View methods side by side.
Choose up to four methods. Add them using the search and share the comparison by copying its link.
| Criterion | 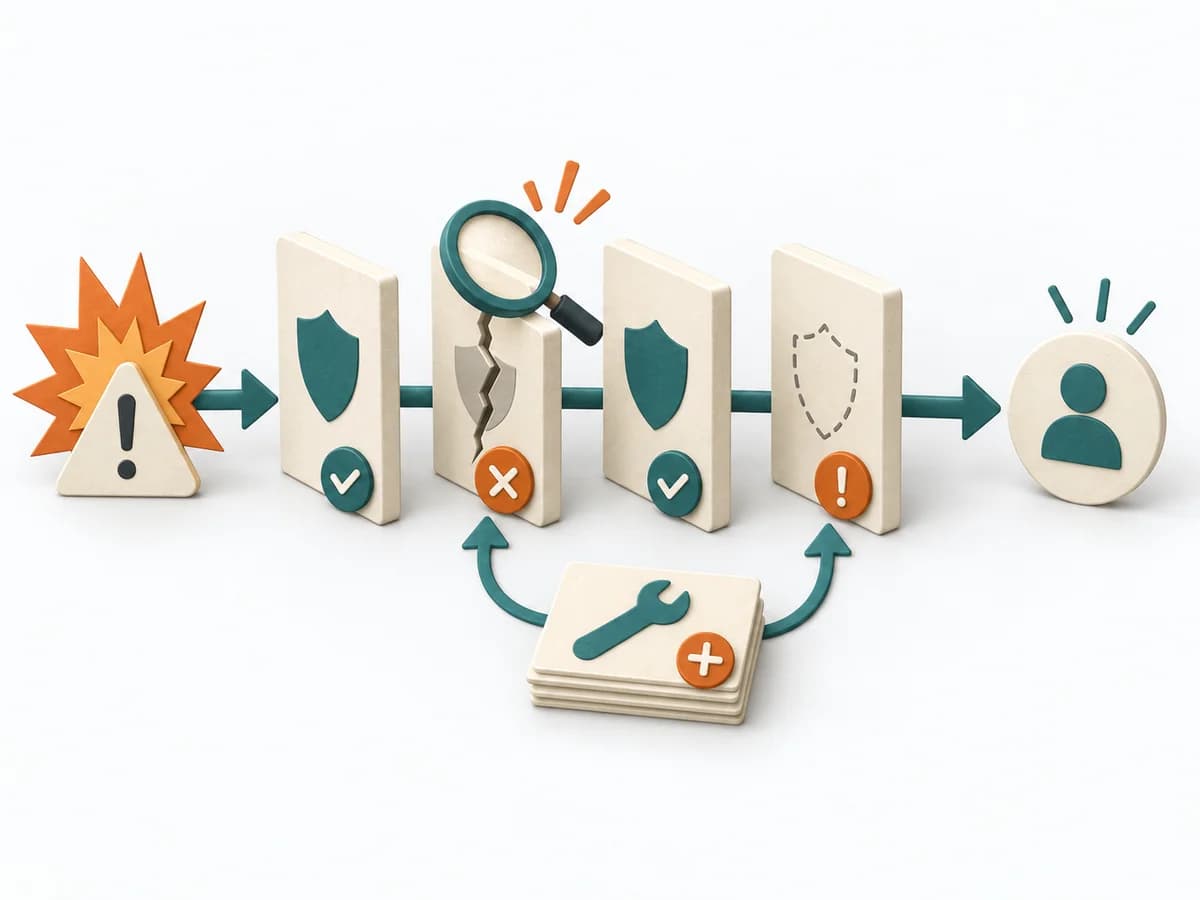 Operations Barrier Analysis | 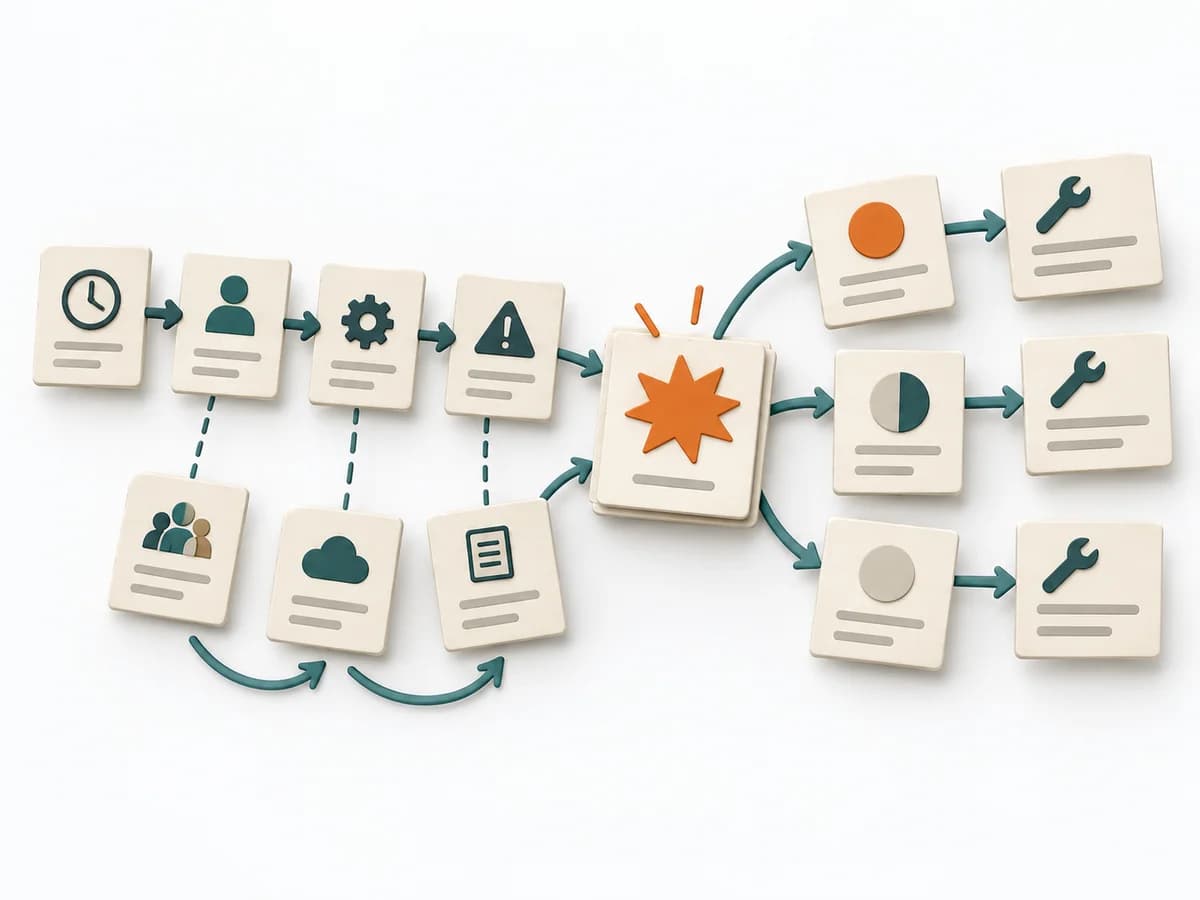 Operations Causal Factor Analysis |  Systems Thinking Causal Loop Diagram |  Operations 5 Whys |
|---|---|---|---|---|
Purposedifferent | For a risk that can only be managed through multiple layers of protection, the method examines the effectiveness of each barrier. It shows where safeguards are missing, too weak, or fail under real conditions. | For an event with a complicated course, the method breaks down the contributing factors along the timeline. It shows how conditions, decisions, and reactions together produce a course of events. | A Causal Loop Diagram makes feedback, reinforcement, and balance in a system legible. It uncovers side effects and self-reinforcement that stay hidden in linear explanations. | For a single, hard-to-explain deviation, the method exposes the causal chain behind the visible symptom. It keeps the cause open until a controllable condition emerges instead of a mere description. |
Complexitydifferent | Medium | High | Medium | Low |
Timedifferent | 2-4 h | 2-6 h | 1-3 h | 15-30 min |
Participantsdifferent | 2-6 | 3-10 | 2-8 | 2-6 |
Formatdifferent | Workshop + async | Workshop + async | Workshop | Workshop |
Outputdifferent | Barrier Inventory, Failure Analysis per Barrier, Action Backlog | Event Timeline, Causal Factor Chart, Cause List, Corrective Actions | Causal Loop Diagram, Feedback Notes, Leverage Points | Root cause notes, Countermeasures |
Tagsno overlap | Root causeSafetyIncident | CausalityIncidentRoot causeTimeline | FeedbackSystems thinkingCausalityDynamics | Root causeIncidentLeanProblem solving |