View methods side by side.
Choose up to four methods. Add them using the search and share the comparison by copying its link.
| Criterion | 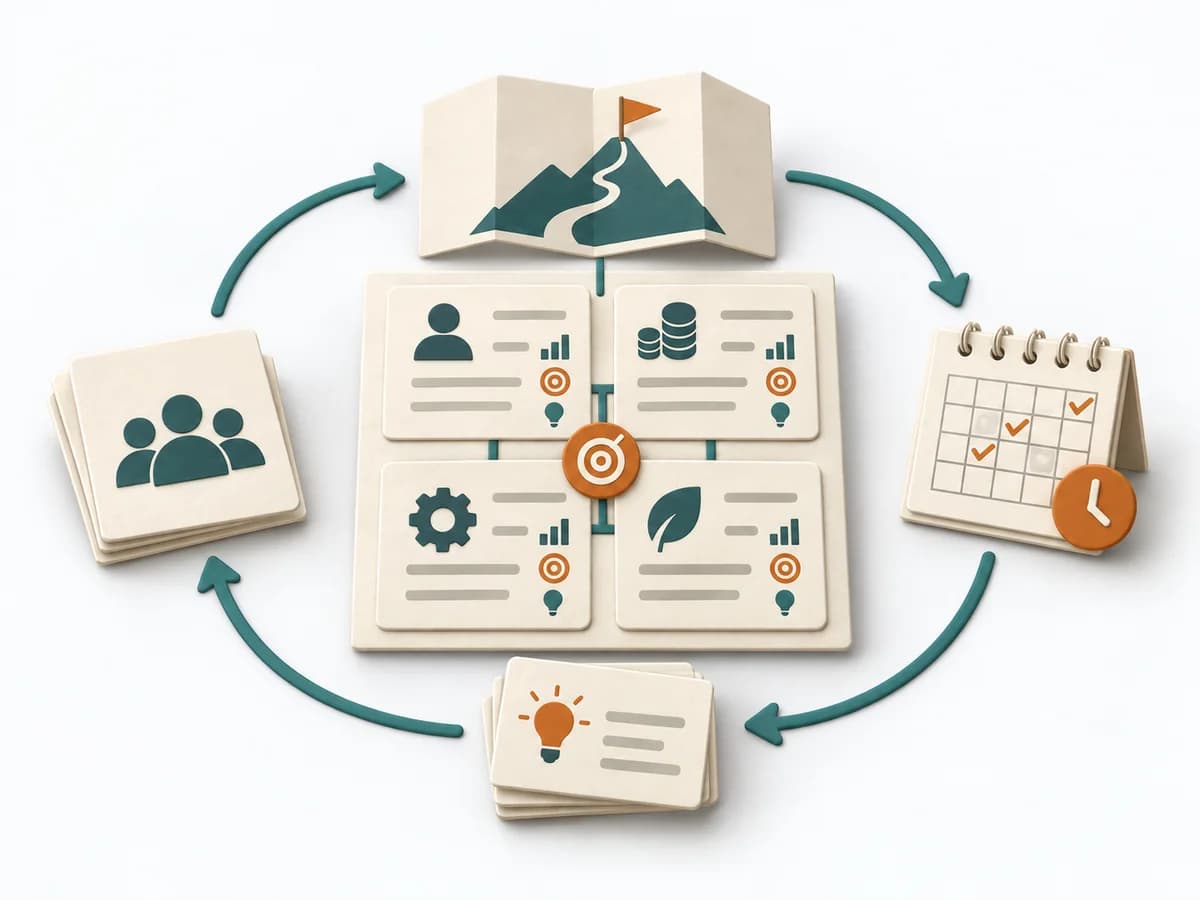 Business Strategy Balanced Scorecard |  UX Research Affinity Diagramming |  Operations 5 Whys |  Operations Root Cause Analysis |
|---|---|---|---|---|
Purposedifferent | Balanced Scorecard translates strategy into a few interconnected perspectives and metrics. It holds impact, steering, and learning together in daily work instead of narrowing strategy down to financial figures. | When research notes, feedback, or observations sit unconnected side by side, affinity diagramming sorts the raw material into solid themes. Many individual points turn into patterns that make decisions and opportunities clearer. | For a single, hard-to-explain deviation, the method exposes the causal chain behind the visible symptom. It keeps the cause open until a controllable condition emerges instead of a mere description. | When a problem keeps recurring and the cause stays unclear, the method exposes the underlying mechanism. It separates symptom, guess, and robust explanation from one another. |
Complexitydifferent | High | Low | Low | Medium |
Timedifferent | Halber Tag bis mehrere Wochen | 45–90 min | 15-30 min | 1-4 h |
Participantsdifferent | 4-12 | 3-10 | 2-6 | 3-8 |
Formatdifferent | Workshop + async | Workshop | Workshop | Workshop + async |
Outputdifferent | Balanced Scorecard, Strategic Measures, Initiative Map | Theme clusters, Insight statements, Opportunity areas | Root cause notes, Countermeasures | Problem Statement, Cause Hypotheses, Confirmed Causes, Action Plan |
Tagsno overlap | StrategyMetricsExecution | SynthesisQualitativeRoot cause | Root causeIncidentLeanProblem solving | Root causeProblem solvingQualityIncident |