View methods side by side.
Choose up to four methods. Add them using the search and share the comparison by copying its link.
Selected:ATAM (Architecture Tradeoff Analysis Method)Monte Carlo ForecastingValue Stream MappingFailure Mode and Effects Analysis
| Criterion |  Architecture ATAM (Architecture Tradeoff Analysis Method) | 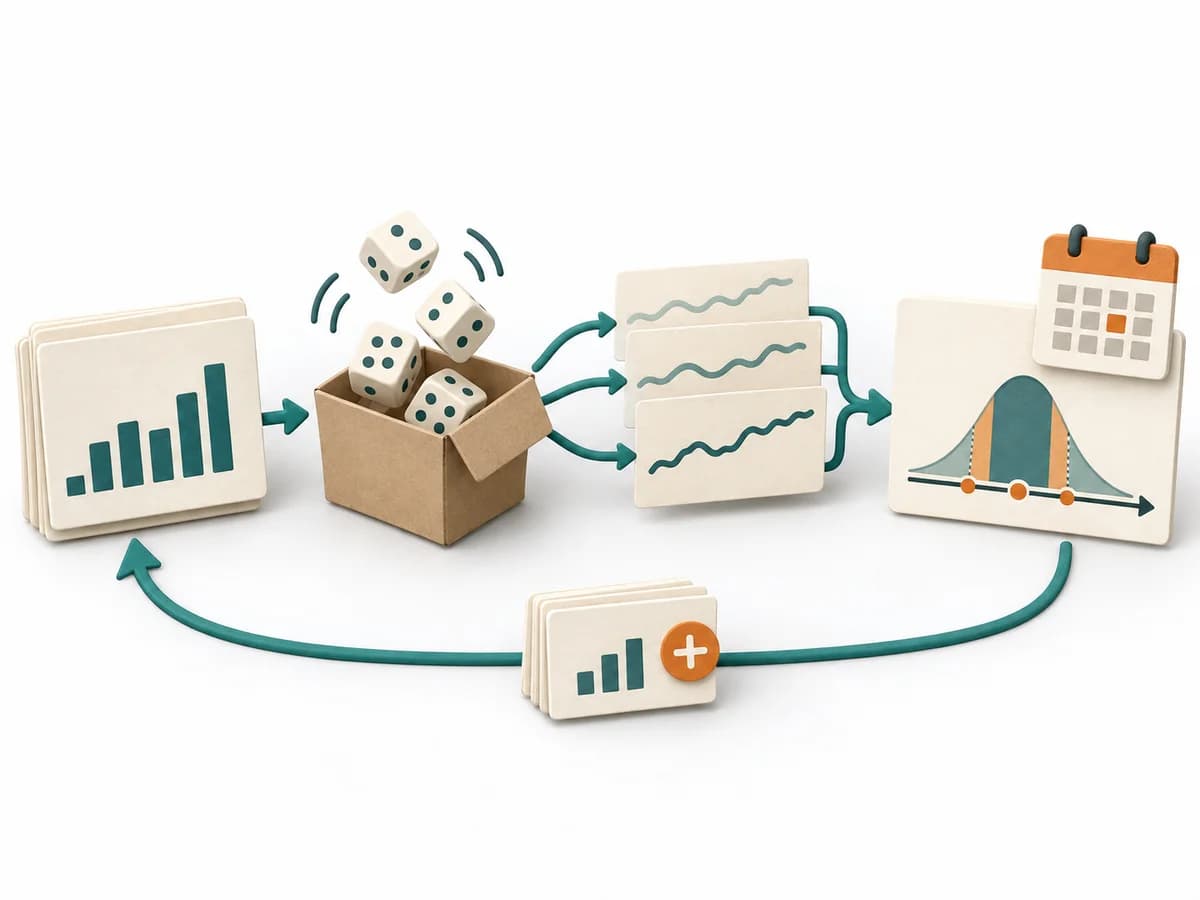 Delivery Monte Carlo Forecasting | 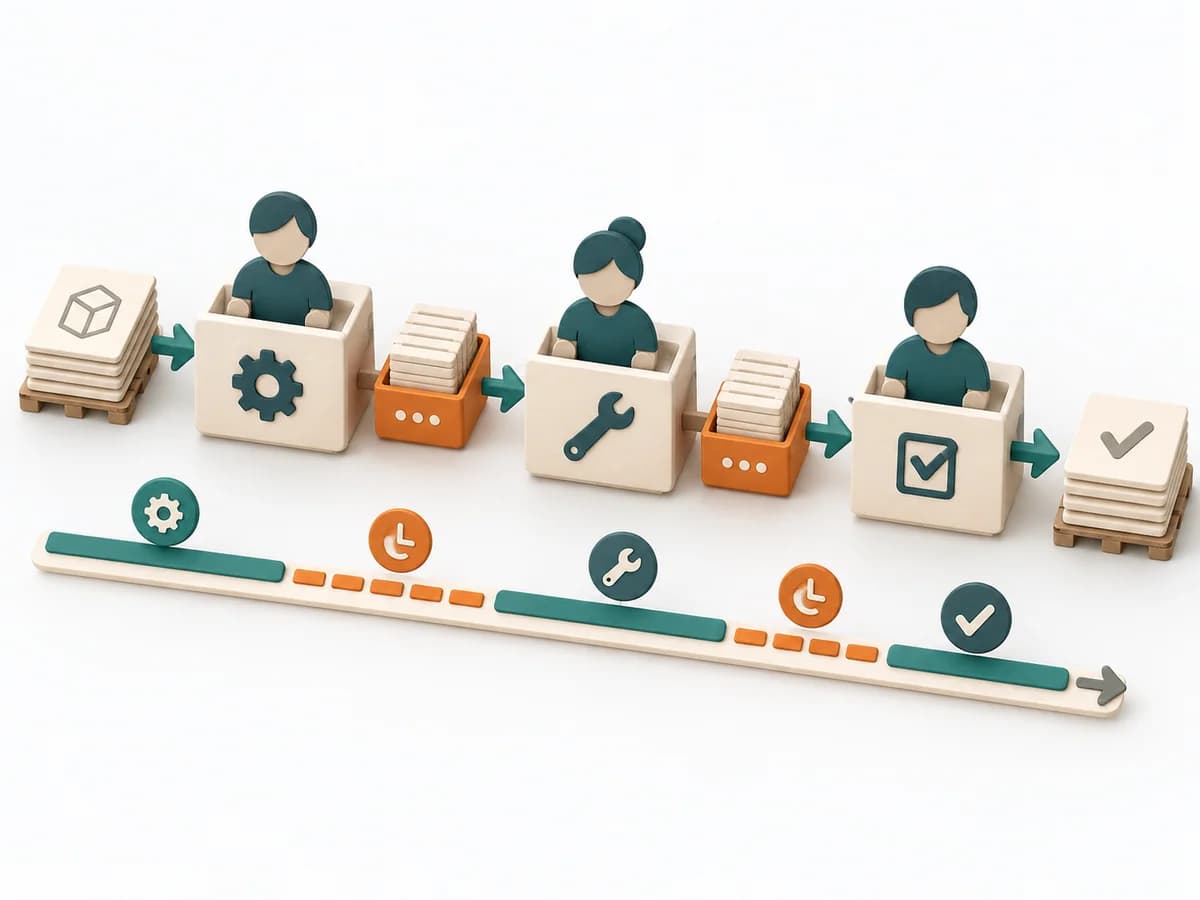 Delivery Value Stream Mapping |  Operations Failure Mode and Effects Analysis |
|---|---|---|---|---|
Purposedifferent | ATAM helps teams weigh architecture decisions when quality goals compete. The team considers business goals, stakeholder expectations, and technical decisions together. The evaluation shows which risks need further investigation. | Helps clarify scope, sequence, and delivery flow in concrete terms. It makes work, boundaries, and order steerable. The result is captured as Forecast Percentiles, Throughput Dataset, and Risk Communication. | When delivery work dissolves into wait times, handoffs, and hidden effort, Value Stream Mapping makes the actual flow visible. The method exposes bottlenecks, idle time, and feedback loops so lead time and improvement levers become tangible. | For a process, product, or service with noticeable failure risks, the method assesses possible failure modes in advance. It directs attention to combinations of occurrence, effect, and detectability. |
Complexitydifferent | High | High | Medium | High |
Timedifferent | Several meetings plus preparation and analysis; total effort depends on scope | 30-90 min Setup, danach laufend | 1-3 h | 2-6 h |
Participantsdifferent | Evaluation team, architects, and relevant stakeholders | 1-8 | 4-10 | 3-10 |
Formatdifferent | Workshop + async | Workshop + async | Workshop | Workshop |
Outputdifferent | Prioritized quality scenarios in a utility tree, Architecture risks with reasoning and assumptions, Sensitivity and trade-off points, Findings report with open investigations | Forecast Percentiles, Throughput Dataset, Risk Communication | Current-state map, Future-state map, Bottleneck list | FMEA Table, Risk Priority, Mitigation Actions |
Tagsno overlap | ArchitectureQualityRiskTradeoffsStakeholders | ForecastingFlowDelivery | LeanFlowWasteDelivery | RiskQualityOperationsRoot cause |