View methods side by side.
Choose up to four methods. Add them using the search and share the comparison by copying its link.
| Criterion |  Business Strategy Ansoff Matrix | 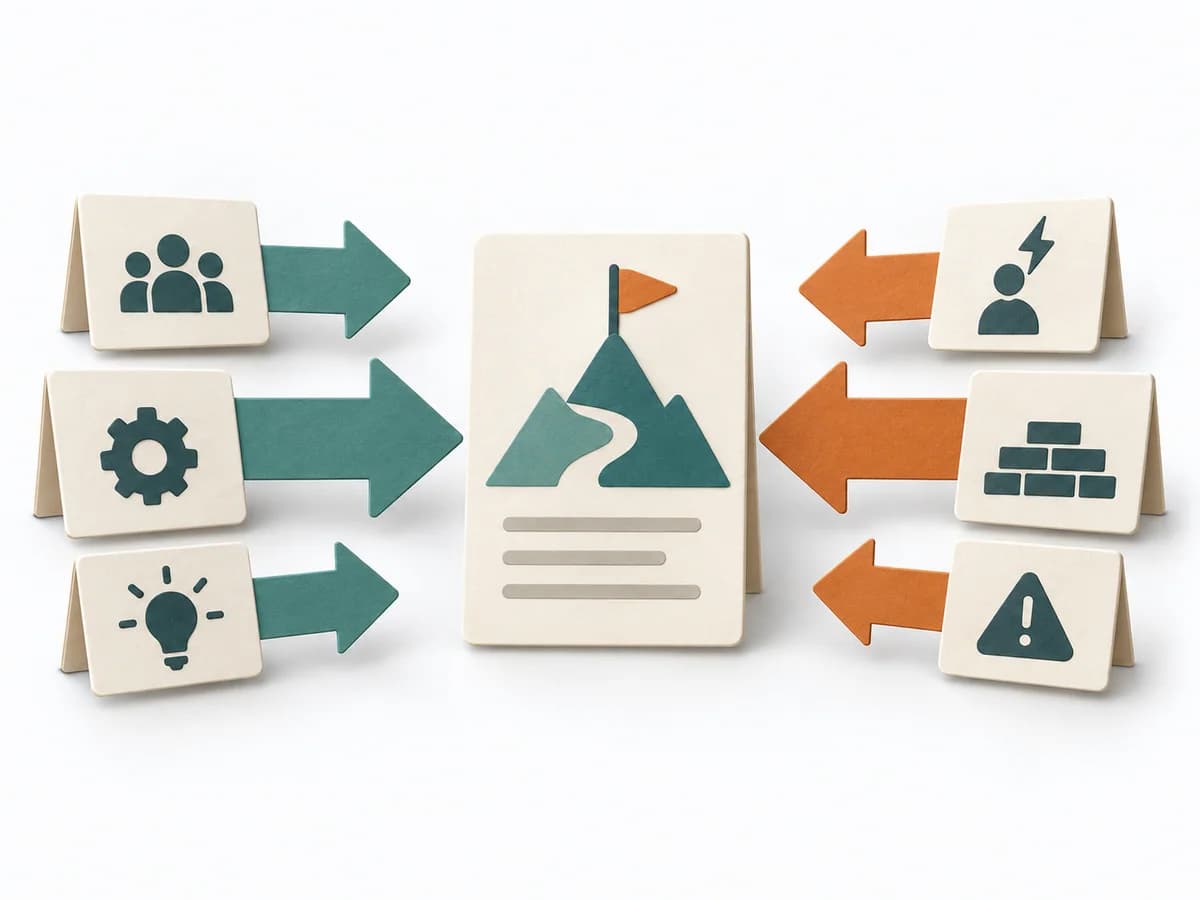 Decision Making Force Field Analysis |  Decision Making OODA Loop |  Product Strategy ICE Scoring |
|---|---|---|---|---|
Purposedifferent | The Ansoff Matrix organizes growth options by market and product relation. It helps weigh expansion, diversification, and adaptation cleanly against each other. | In change initiatives, supporting and restraining forces sit at the table at the same time. Force Field Analysis makes these tensions explicit and shows where change can be pushed forward by strengthening or relieving. | In dynamic situations, decisions become outdated faster than they can be prepared. The OODA Loop holds observing, orienting, deciding, and acting together as a recurring rhythm so reaction does not slide into inertia. | When ideas need sorting quickly, it condenses impact, confidence, and effort into one compact score. It connects customer value, product logic, and decision priorities. The result is captured as an ICE table and top-ideas list. |
Complexitydifferent | Low | Low | Medium | Low |
Timedifferent | 45-90 min | 45-90 min | 15-60 min je Zyklus | 30-60 min |
Participantsdifferent | 2-8 | 3-12 | 1-8 | 2-8 |
Formatdifferent | Workshop + async | Workshop | Workshop + async | Workshop + async |
Outputdifferent | Ansoff Matrix, Growth Options, Risk Notes | Force Field Map, Change Levers, Risk Notes | Situation Assessment, Decision Loop, Action Updates | ICE Table, Top Idea List |
Tagsno overlap | GrowthStrategyMarketPortfolio | ChangeDecisionStrategy | DecisionChangeLearningStrategy | PrioritizationScoringGrowthDecision |