View methods side by side.
Choose up to four methods. Add them using the search and share the comparison by copying its link.
| Criterion |  Operations ALPEN Method |  Operations Fishbone Diagram |  Decision Making OODA Loop | 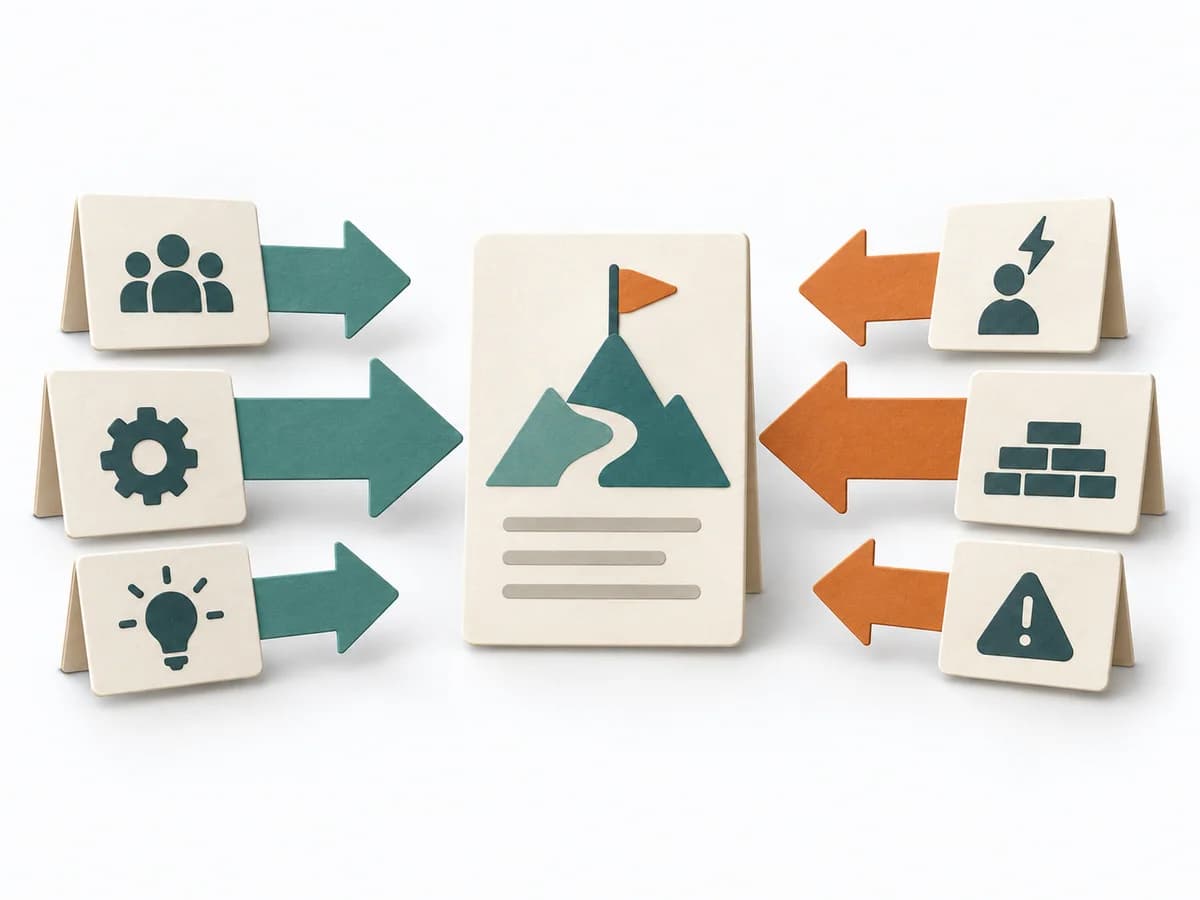 Decision Making Force Field Analysis |
|---|---|---|---|---|
Purposedifferent | With an overloaded day full of too many tasks, a realistic picture of the day emerges. The method connects estimating, deciding, and buffer thinking so planning fits available energy and time. | When a problem has several possible contributing factors, the method sorts causes by cause areas. It prevents an initial hunch from blocking the view of other plausible drivers. | In dynamic situations, decisions become outdated faster than they can be prepared. The OODA Loop holds observing, orienting, deciding, and acting together as a recurring rhythm so reaction does not slide into inertia. | In change initiatives, supporting and restraining forces sit at the table at the same time. Force Field Analysis makes these tensions explicit and shows where change can be pushed forward by strengthening or relieving. |
Complexitydifferent | Low | Low | Medium | Low |
Timedifferent | 10-20 min daily | 30-60 min | 15-60 min je Zyklus | 45-90 min |
Participantsdifferent | 1 | 2-8 | 1-8 | 3-12 |
Formatdifferent | Async | Workshop | Workshop + async | Workshop |
Outputdifferent | Daily Plan, Time Estimates, Review Notes | Fishbone Diagram, Cause Categories, Investigation Backlog | Situation Assessment, Decision Loop, Action Updates | Force Field Map, Change Levers, Risk Notes |
Tagsno overlap | PlanningTime managementProductivityOperations | Root causeQualityOperations | DecisionChangeLearningStrategy | ChangeDecisionStrategy |