View methods side by side.
Choose up to four methods. Add them using the search and share the comparison by copying its link.
| Criterion | 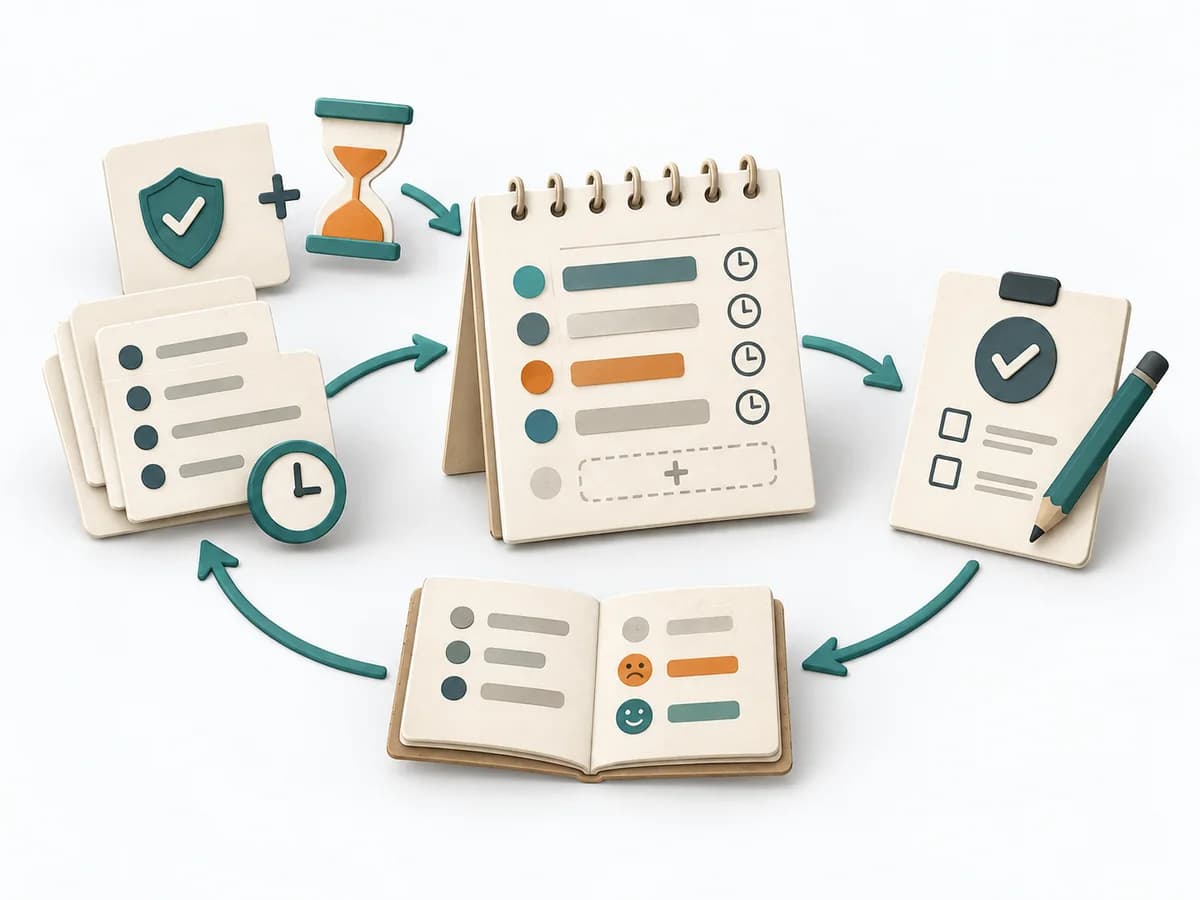 Operations ALPEN Method |  Systems Thinking Causal Loop Diagram | 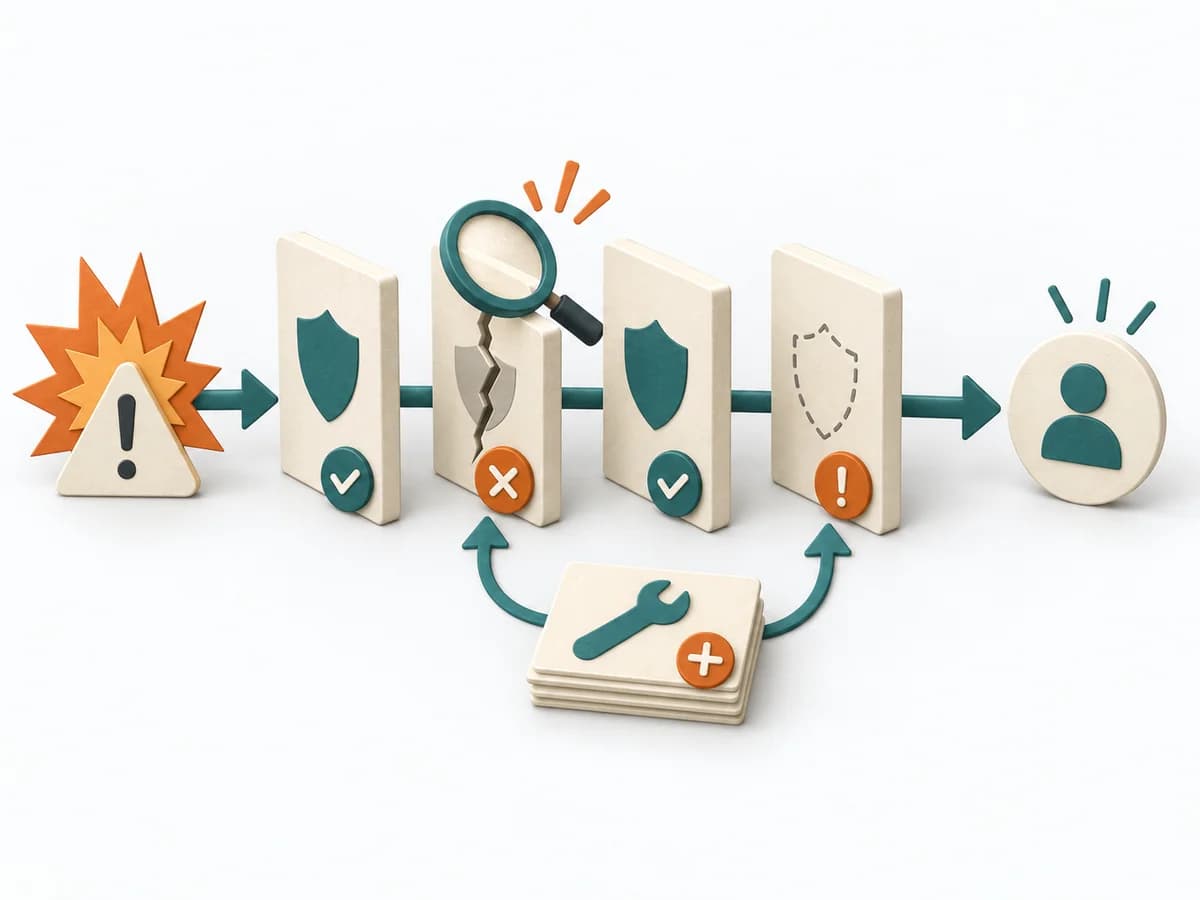 Operations Barrier Analysis | 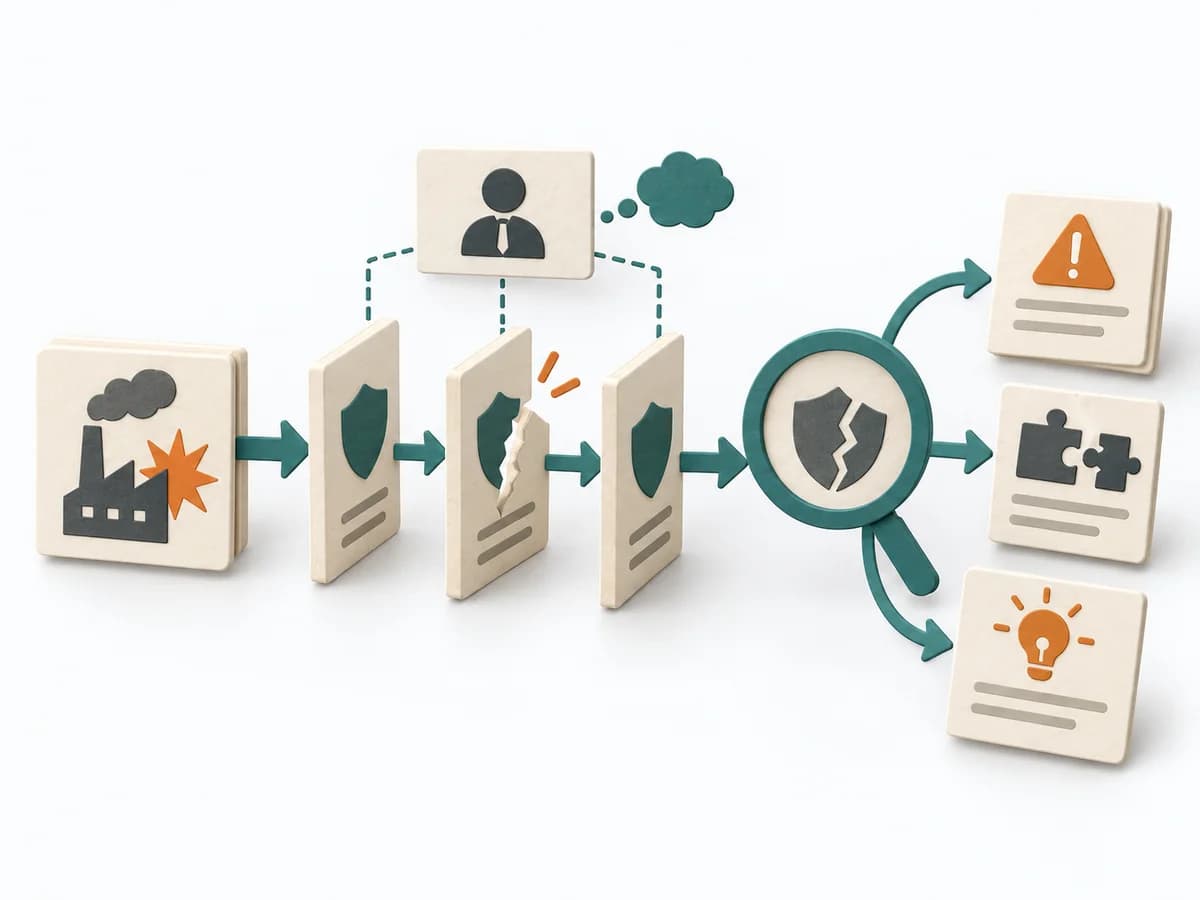 Operations MORT Analysis |
|---|---|---|---|---|
Purposedifferent | With an overloaded day full of too many tasks, a realistic picture of the day emerges. The method connects estimating, deciding, and buffer thinking so planning fits available energy and time. | A Causal Loop Diagram makes feedback, reinforcement, and balance in a system legible. It uncovers side effects and self-reinforcement that stay hidden in linear explanations. | For a risk that can only be managed through multiple layers of protection, the method examines the effectiveness of each barrier. It shows where safeguards are missing, too weak, or fail under real conditions. | For a safety-relevant event or a system with high protection requirements, the method examines where controls failed. It exposes both technical and organizational gaps. |
Complexitydifferent | Low | Medium | Medium | High |
Timedifferent | 10-20 min daily | 1-3 h | 2-4 h | Mehrere Tage bis Wochen |
Participantsdifferent | 1 | 2-8 | 2-6 | 2-6 |
Formatdifferent | Async | Workshop | Workshop + async | Workshop + async |
Outputdifferent | Daily Plan, Time Estimates, Review Notes | Causal Loop Diagram, Feedback Notes, Leverage Points | Barrier Inventory, Failure Analysis per Barrier, Action Backlog | MORT Worksheets, Findings per Branch, Corrective Actions, Systemic Recommendations |
Tagsno overlap | PlanningTime managementProductivityOperations | FeedbackSystems thinkingCausalityDynamics | Root causeSafetyIncident | Root causeSafetySystemicIncident |