View methods side by side.
Choose up to four methods. Add them using the search and share the comparison by copying its link.
| Criterion |  Facilitation Alignment Mapping | 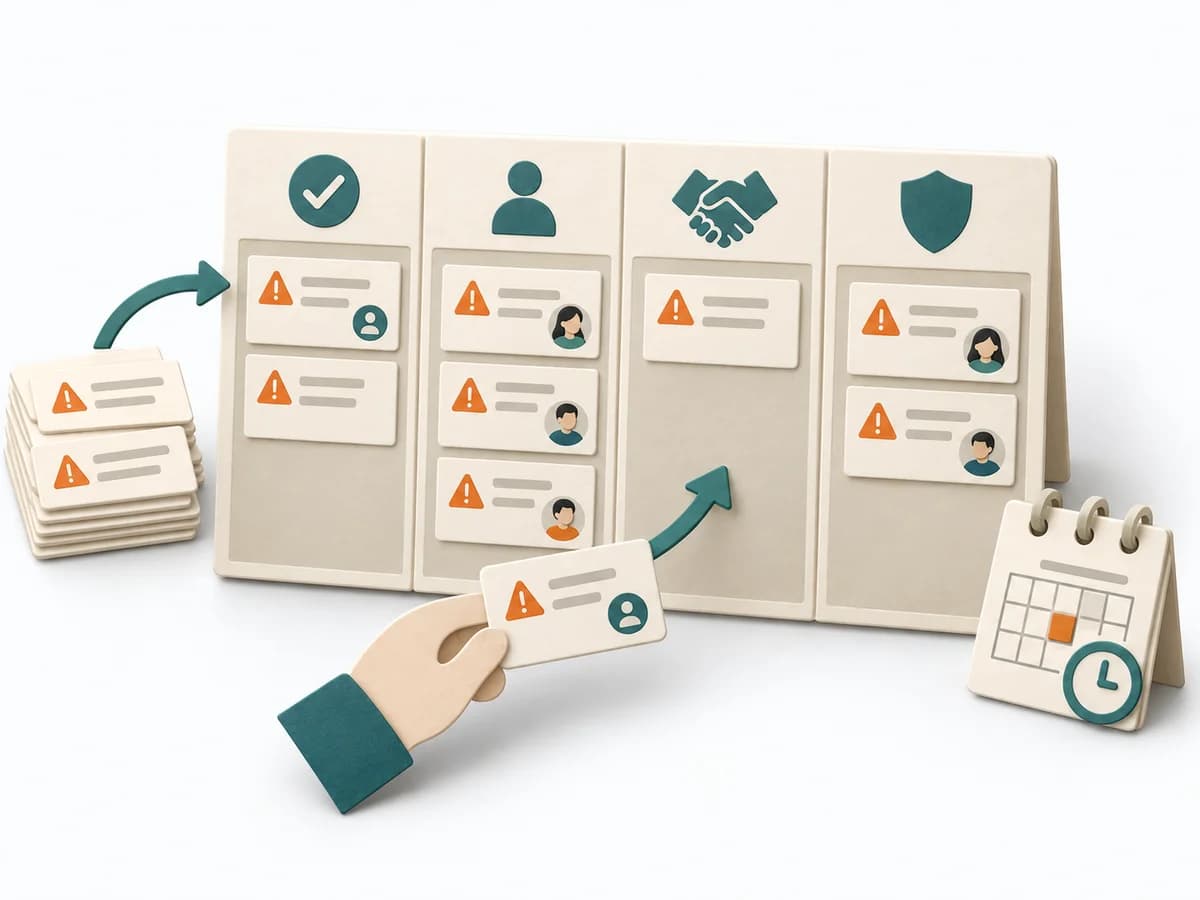 Agile ROAM Board |  Growth North Star Metric | 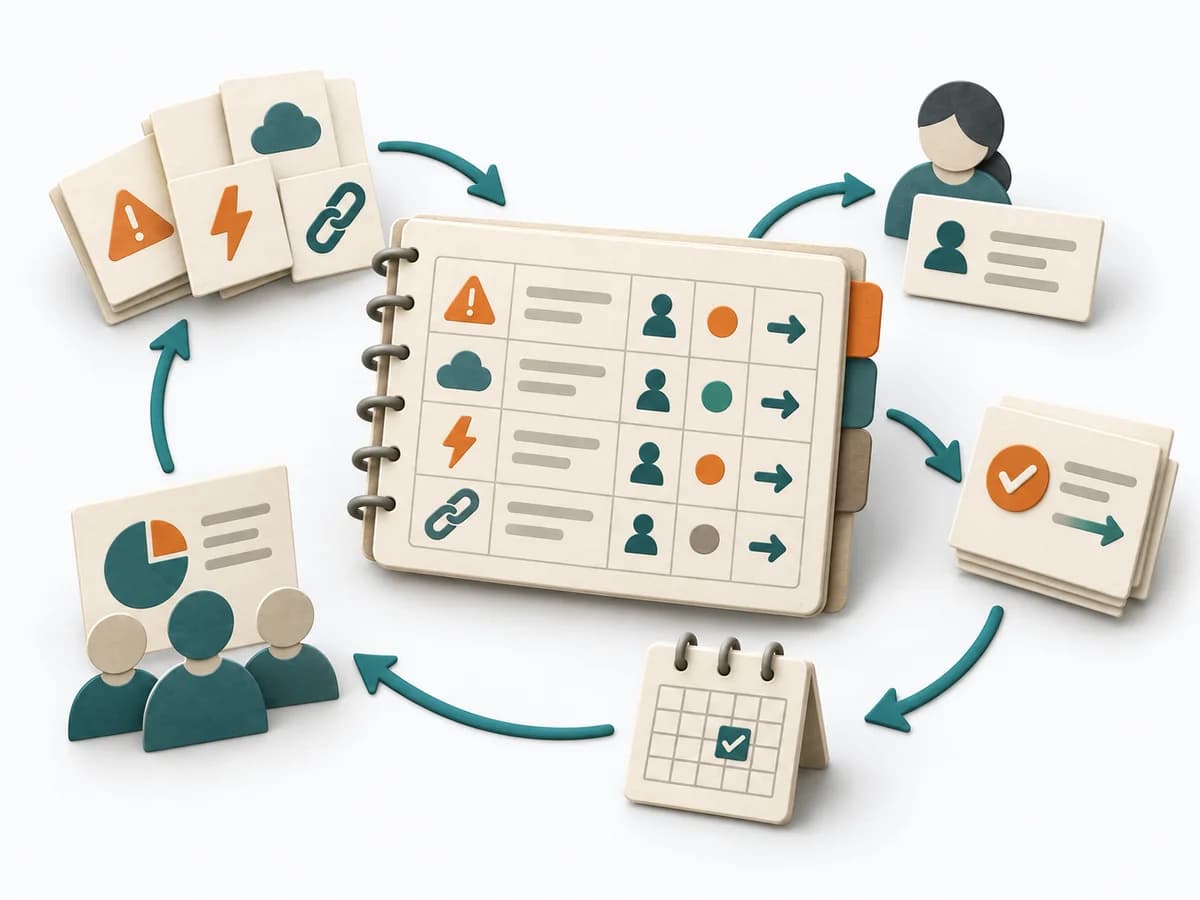 Delivery RAID Log |
|---|---|---|---|---|
Purposedifferent | When several people work toward one goal but hold different mental maps, Alignment Mapping makes the discrepancies visible. It arranges goals, assumptions, and priorities so shared direction becomes verifiable. | When work needs to move between different states or columns, it makes that movement and its handoffs legible. It sorts work by value, risk, and delivery ability. The result is captured as a ROAM Board and an Owner List. | When product teams track many metrics, the view of the actual customer outcome easily gets lost. A North Star Metric bundles growth, usage, and value contribution into one signal that makes the system's direction visible. | Helps clarify scope, sequence, and delivery flow in concrete terms. It makes work, boundaries, and order steerable. The result is captured as a RAID Log and a source for status reporting. |
Complexitydifferent | Medium | Low | Medium | Low |
Timedifferent | 1-2 h | 20-40 min initial, dann laufend | 1-2 h | 30 min Setup, dann laufend |
Participantsdifferent | 4-12 | 3-15 | 3-8 | 1-3 maintaining, briefing for everyone |
Formatdifferent | Workshop | Workshop + async | Workshop + async | Async |
Outputdifferent | Alignment Map, Open Issues, Decision Questions | ROAM Board, Owner List | North Star metric, Input metric tree, Measurement cadence | RAID Log, Status Report Source |
Tagsno overlap | AlignmentStakeholdersStrategyFacilitation | RiskAgileTrackingAlignment | GrowthMetricsAlignmentRetention | RiskTrackingStakeholdersGovernance |