View methods side by side.
Choose up to four methods. Add them using the search and share the comparison by copying its link.
| Criterion | 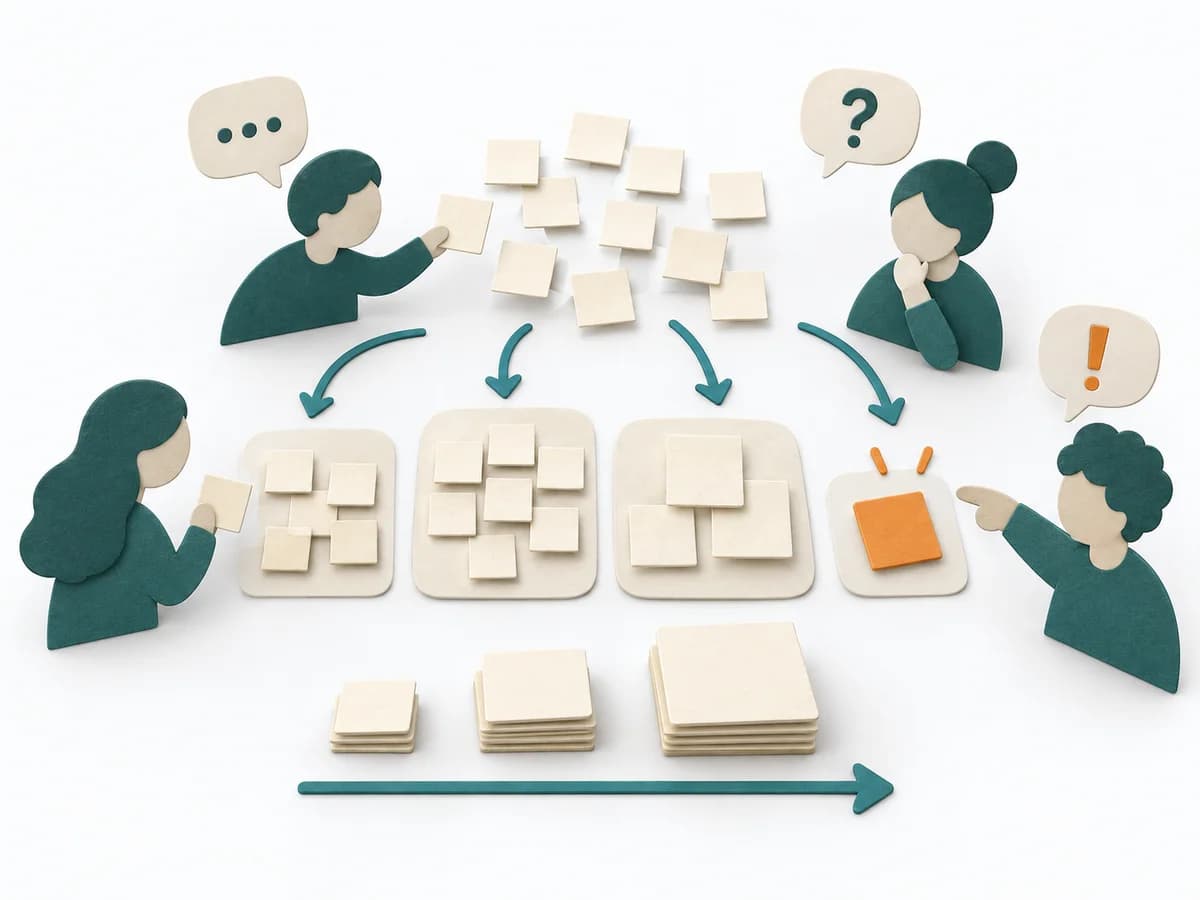 Agile Affinity Estimation |  Agile NoEstimates | 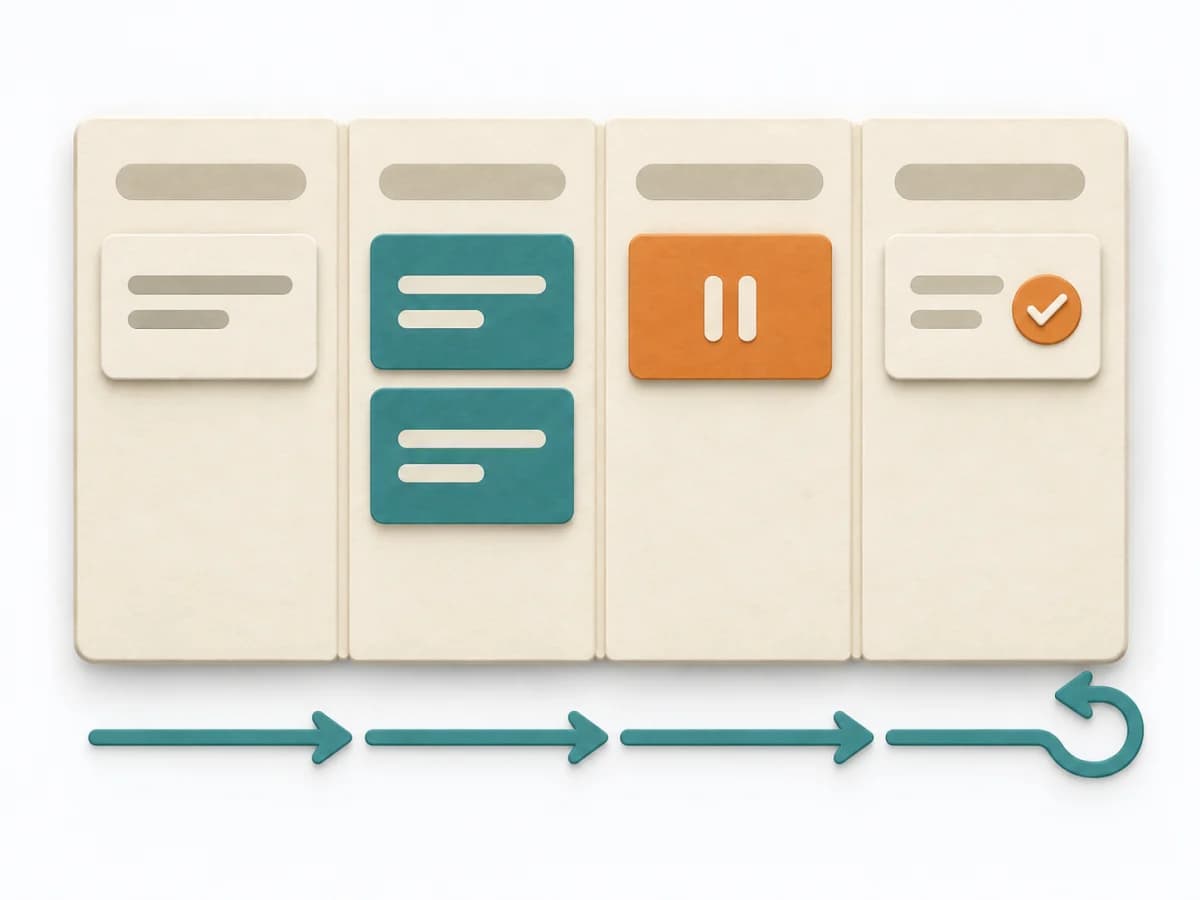 Engineering Kanban |  Delivery Monte Carlo Forecasting |
|---|---|---|---|---|
Purposedifferent | When many tasks need to be classified quickly, it sorts them by perceived effort and similarity. It reduces the effort of fine-grained estimation for large volumes. | When estimating slows a team down more than it helps, it shifts the focus to flow, small slices, and real lead time. It sorts work by value, risk, and delivery ability. The result is captured as Throughput Data, Flow Forecast, and Slicing Rules. | When work sits in too many parallel streams, throughput suffers and no one sees the bottlenecks. Kanban makes the flow of work visible and limits overload so a system becomes calmer and more predictable. | Helps clarify scope, sequence, and delivery flow in concrete terms. It makes work, boundaries, and order steerable. The result is captured as Forecast Percentiles, Throughput Dataset, and Risk Communication. |
Complexitydifferent | Medium | Medium | Medium | High |
Timedifferent | 30-90 min | laufend | Ongoing | 30-90 min Setup, danach laufend |
Participantsdifferent | 3-12 | 2-12 | 2-12 | 1-8 |
Formatdifferent | Workshop | Workshop + async | Workshop + async | Workshop + async |
Outputdifferent | Affinity Size Map, Grouped Estimates, Unclear Items | Throughput Data, Flow Forecast, Slicing Rules | Kanban board, WIP policies, Flow metrics | Forecast Percentiles, Throughput Dataset, Risk Communication |
Tagsno overlap | EstimationBacklogRelative sizing | EstimationForecastingFlow | FlowVisual managementDelivery | ForecastingFlowDelivery |