View methods side by side.
Choose up to four methods. Add them using the search and share the comparison by copying its link.
| Criterion |  UX Research Affinity Diagramming | 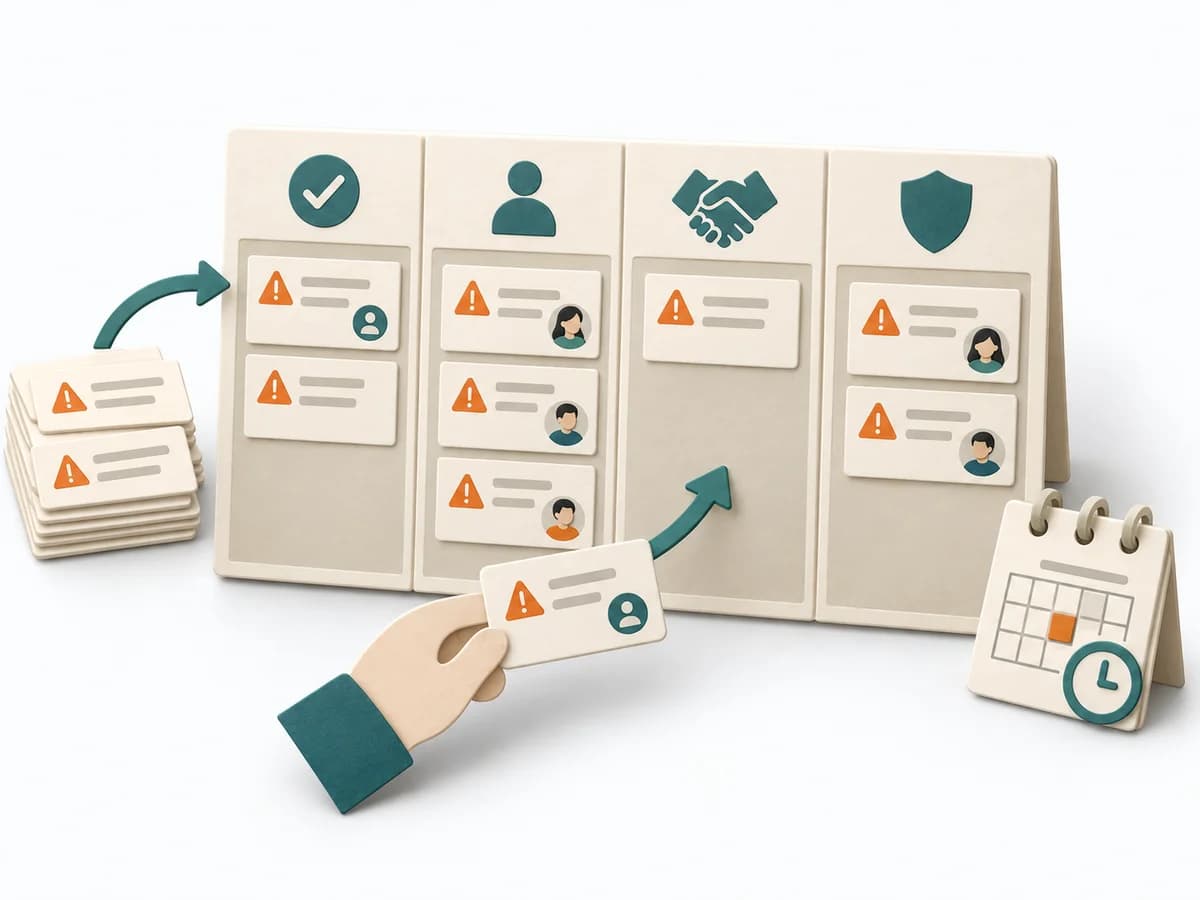 Agile ROAM Board |  Operations Root Cause Analysis |  Operations Failure Mode and Effects Analysis |
|---|---|---|---|---|
Purposedifferent | When research notes, feedback, or observations sit unconnected side by side, affinity diagramming sorts the raw material into solid themes. Many individual points turn into patterns that make decisions and opportunities clearer. | When work needs to move between different states or columns, it makes that movement and its handoffs legible. It sorts work by value, risk, and delivery ability. The result is captured as a ROAM Board and an Owner List. | When a problem keeps recurring and the cause stays unclear, the method exposes the underlying mechanism. It separates symptom, guess, and robust explanation from one another. | For a process, product, or service with noticeable failure risks, the method assesses possible failure modes in advance. It directs attention to combinations of occurrence, effect, and detectability. |
Complexitydifferent | Low | Low | Medium | High |
Timedifferent | 45–90 min | 20-40 min initial, dann laufend | 1-4 h | 2-6 h |
Participantsdifferent | 3-10 | 3-15 | 3-8 | 3-10 |
Formatdifferent | Workshop | Workshop + async | Workshop + async | Workshop |
Outputdifferent | Theme clusters, Insight statements, Opportunity areas | ROAM Board, Owner List | Problem Statement, Cause Hypotheses, Confirmed Causes, Action Plan | FMEA Table, Risk Priority, Mitigation Actions |
Tagsno overlap | SynthesisQualitativeRoot cause | RiskAgileTrackingAlignment | Root causeProblem solvingQualityIncident | RiskQualityOperationsRoot cause |