View methods side by side.
Choose up to four methods. Add them using the search and share the comparison by copying its link.
| Criterion |  UX Research Affinity Diagramming |  Decision Making OODA Loop |  Product Discovery Assumption Mapping | 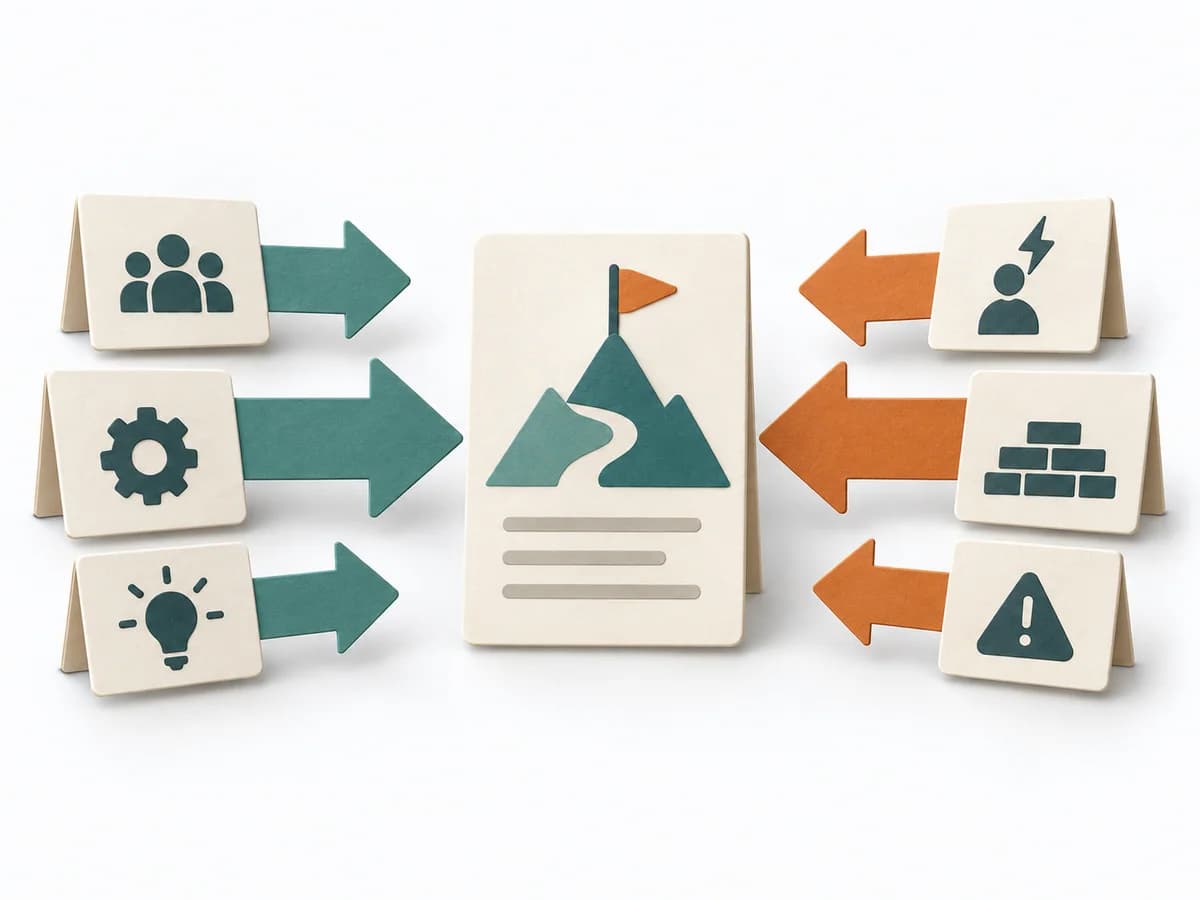 Decision Making Force Field Analysis |
|---|---|---|---|---|
Purposedifferent | When research notes, feedback, or observations sit unconnected side by side, affinity diagramming sorts the raw material into solid themes. Many individual points turn into patterns that make decisions and opportunities clearer. | In dynamic situations, decisions become outdated faster than they can be prepared. The OODA Loop holds observing, orienting, deciding, and acting together as a recurring rhythm so reaction does not slide into inertia. | When assumptions still sit unordered in the room, it weighs uncertainty against leverage. It makes visible which hypotheses should be checked first. | In change initiatives, supporting and restraining forces sit at the table at the same time. Force Field Analysis makes these tensions explicit and shows where change can be pushed forward by strengthening or relieving. |
Complexitydifferent | Low | Medium | Medium | Low |
Timedifferent | 45–90 min | 15-60 min je Zyklus | 45-60 min | 45-90 min |
Participantsdifferent | 3-10 | 1-8 | 2-8 | 3-12 |
Formatdifferent | Workshop | Workshop + async | Workshop + async | Workshop |
Outputdifferent | Theme clusters, Insight statements, Opportunity areas | Situation Assessment, Decision Loop, Action Updates | Assumption map, Test backlog, Risk ranking | Force Field Map, Change Levers, Risk Notes |
Tagsno overlap | SynthesisQualitativeRoot cause | DecisionChangeLearningStrategy | AssumptionsRiskExperimentsValidation | ChangeDecisionStrategy |