View methods side by side.
Choose up to four methods. Add them using the search and share the comparison by copying its link.
| Criterion |  UX Research Affinity Diagramming | 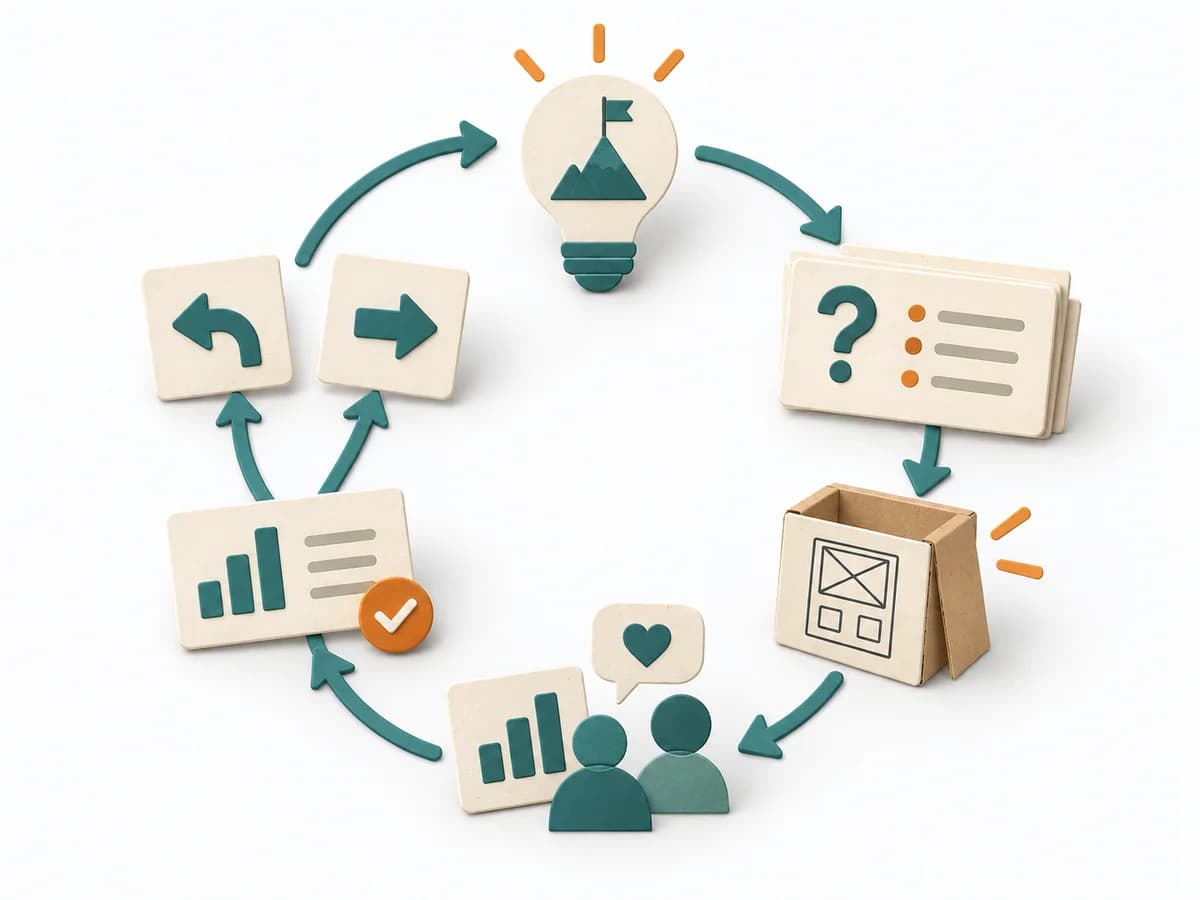 Innovation Lean Startup |  Product Discovery Assumption Mapping |  Operations 5 Whys |
|---|---|---|---|---|
Purposedifferent | When research notes, feedback, or observations sit unconnected side by side, affinity diagramming sorts the raw material into solid themes. Many individual points turn into patterns that make decisions and opportunities clearer. | For uncertain business assumptions, the method forces the idea into contact with real market reactions early. It separates wishful picture, assumption, and observable behavior, so that learning becomes faster than planning. This translates uncertainty into measurable insight. | When assumptions still sit unordered in the room, it weighs uncertainty against leverage. It makes visible which hypotheses should be checked first. | For a single, hard-to-explain deviation, the method exposes the causal chain behind the visible symptom. It keeps the cause open until a controllable condition emerges instead of a mere description. |
Complexitydifferent | Low | Medium | Medium | Low |
Timedifferent | 45–90 min | Wochen bis Monate je Lernzyklus | 45-60 min | 15-30 min |
Participantsdifferent | 3-10 | 2-8 | 2-8 | 2-6 |
Formatdifferent | Workshop | Workshop + async | Workshop + async | Workshop |
Outputdifferent | Theme clusters, Insight statements, Opportunity areas | Hypothesis list, MVPs, Learning reports, Pivot or persevere decision | Assumption map, Test backlog, Risk ranking | Root cause notes, Countermeasures |
Tagsno overlap | SynthesisQualitativeRoot cause | LeanStartupValidationMVP | AssumptionsRiskExperimentsValidation | Root causeIncidentLeanProblem solving |