View methods side by side.
Choose up to four methods. Add them using the search and share the comparison by copying its link.
| Criterion |  UX Research Affinity Diagramming |  Product Strategy ICE Scoring | 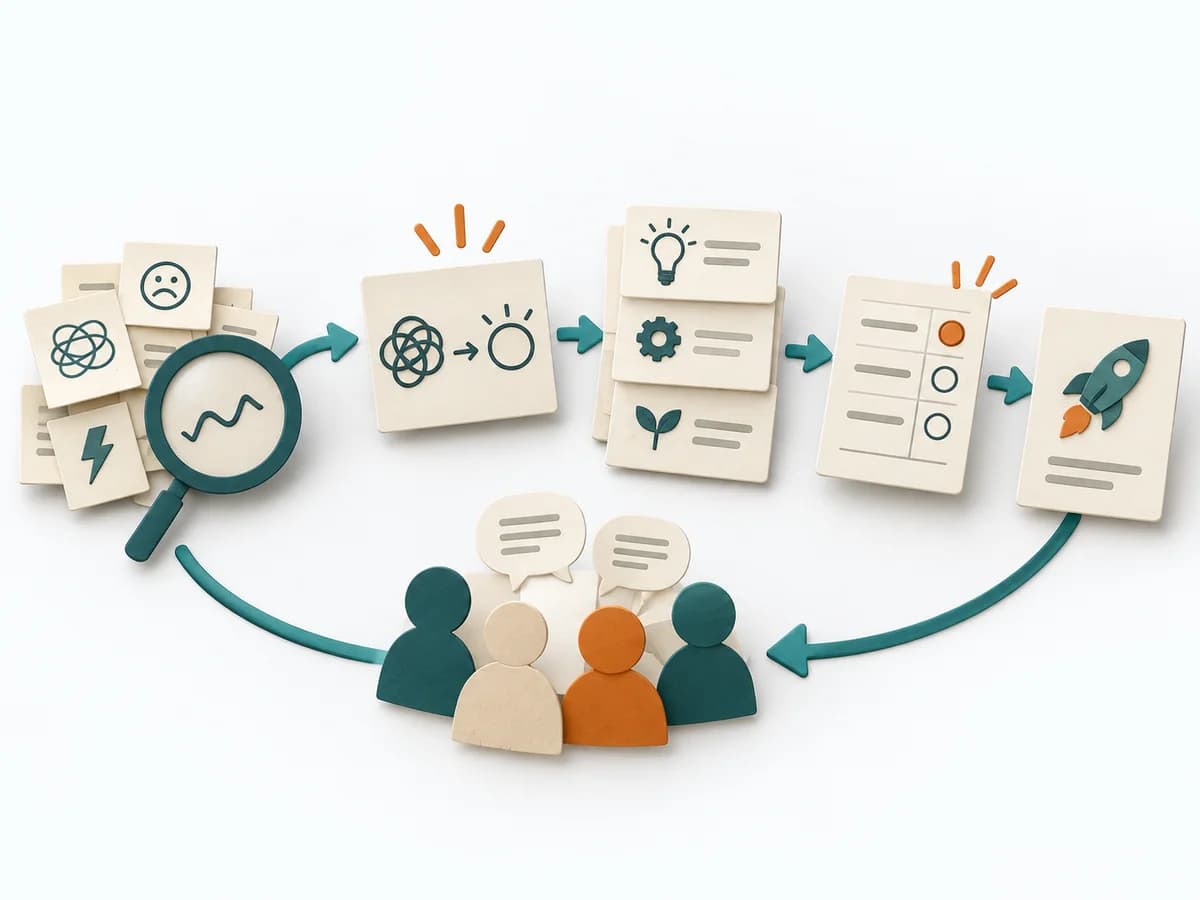 Facilitation Decision Jam | 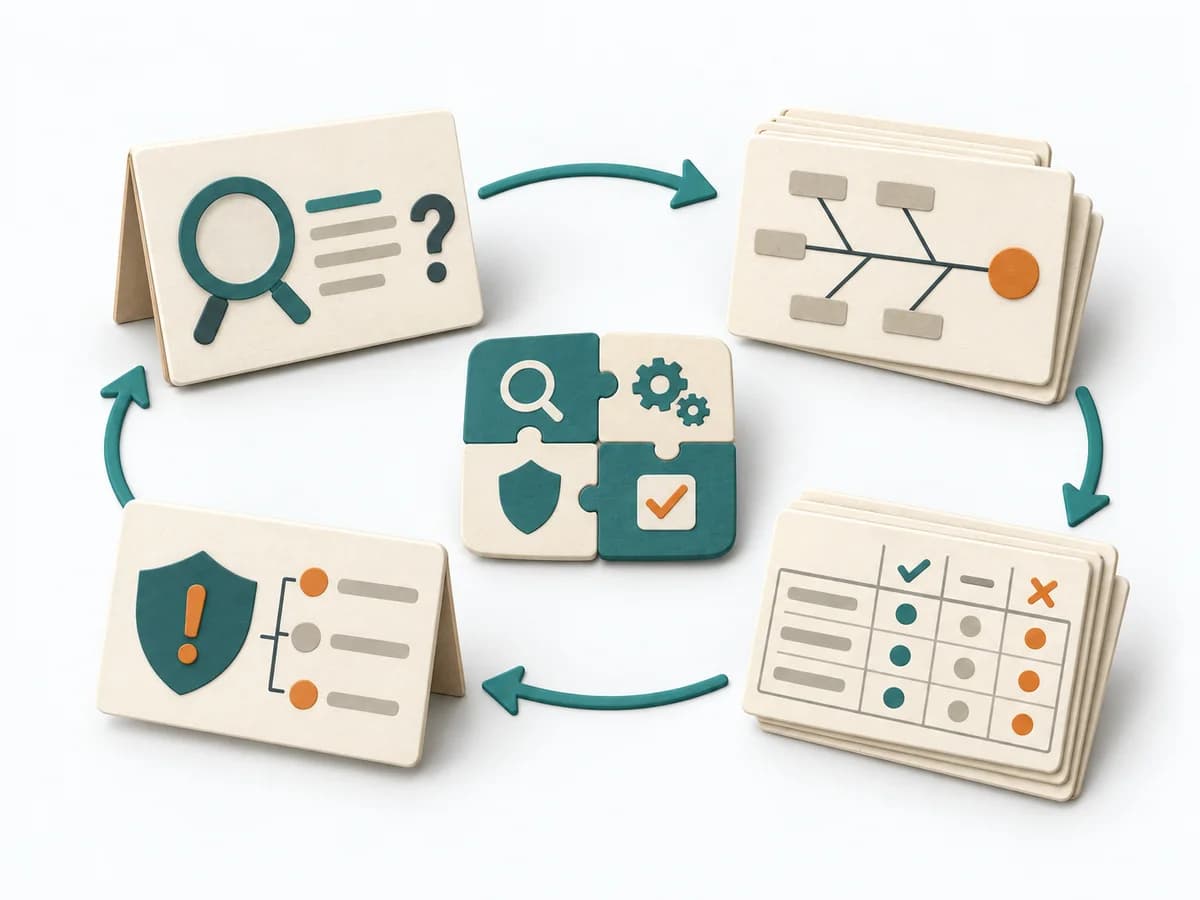 Operations Kepner-Tregoe |
|---|---|---|---|---|
Purposedifferent | When research notes, feedback, or observations sit unconnected side by side, affinity diagramming sorts the raw material into solid themes. Many individual points turn into patterns that make decisions and opportunities clearer. | When ideas need sorting quickly, it condenses impact, confidence, and effort into one compact score. It connects customer value, product logic, and decision priorities. The result is captured as an ICE table and top-ideas list. | When a decision is stuck, Decision Jam loosens the knot through structured separation of problem, idea, and selection. The format creates movement without jumping prematurely at the first seemingly elegant answer. | For a disturbance that's hard to pin down, the method cleanly separates problem, cause, and decision. It reduces mixing when symptoms allow several interpretations. |
Complexitydifferent | Low | Low | Low | High |
Timedifferent | 45–90 min | 30-60 min | 60-90 min | 2-8 h |
Participantsdifferent | 3-10 | 2-8 | 4-10 | 2-8 |
Formatdifferent | Workshop | Workshop + async | Workshop | Workshop + async |
Outputdifferent | Theme clusters, Insight statements, Opportunity areas | ICE Table, Top Idea List | Problem Cluster, Prioritized Challenge, Experiment | Problem Analysis, Decision Analysis, Risk Plan |
Tagsno overlap | SynthesisQualitativeRoot cause | PrioritizationScoringGrowthDecision | FacilitationDecisionProblem solvingWorkshop | Problem solvingRoot causeDecisionOperations |