View methods side by side.
Choose up to four methods. Add them using the search and share the comparison by copying its link.
| Criterion |  UX Research Affinity Diagramming | 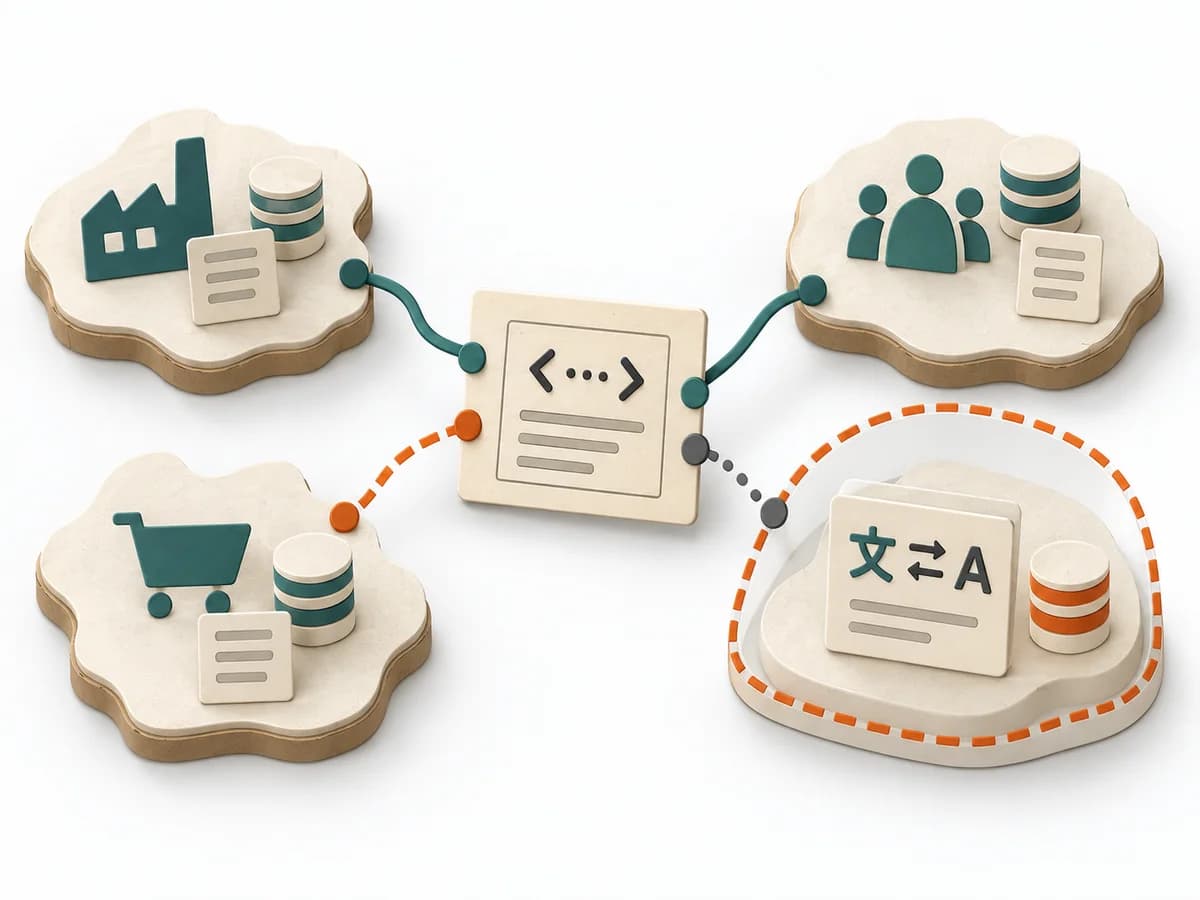 Domain Modeling Context Map |  Operations Root Cause Analysis | 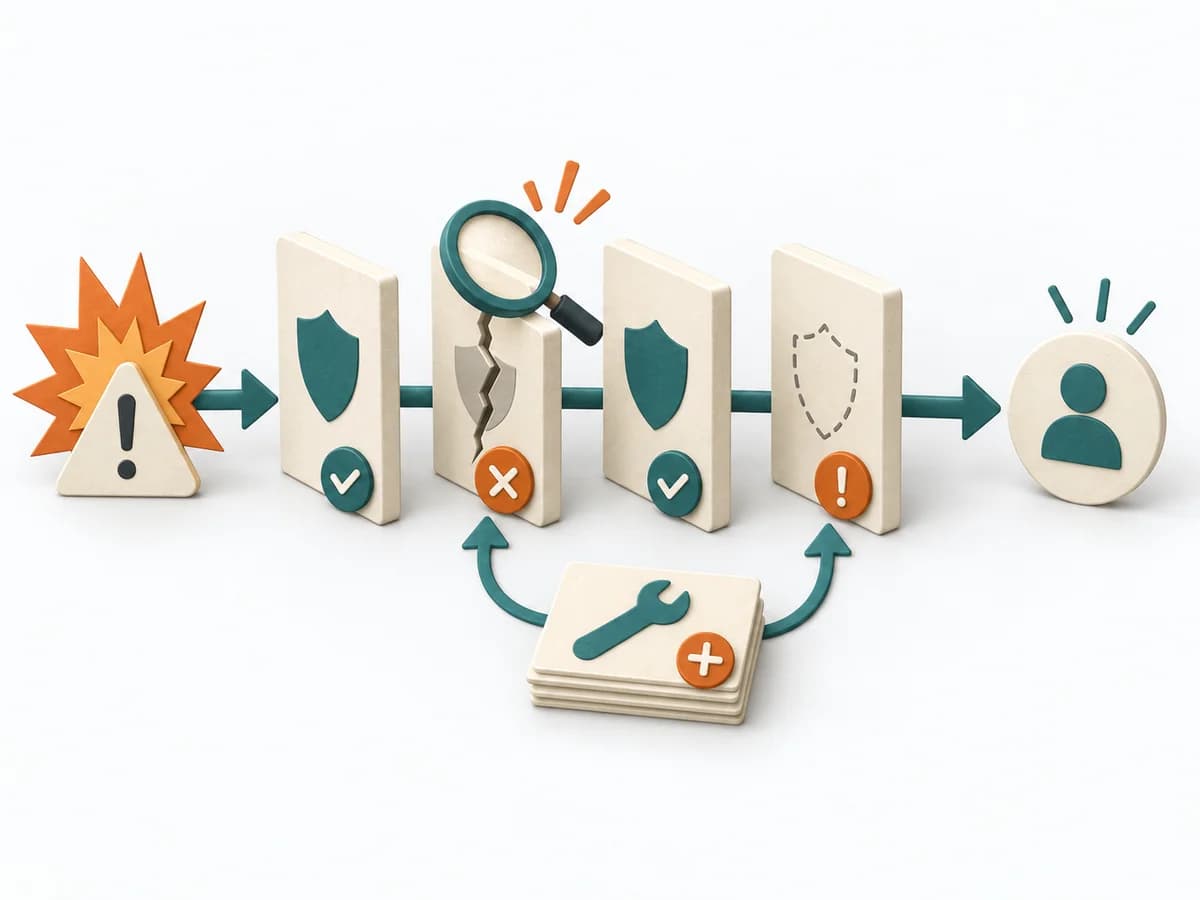 Operations Barrier Analysis |
|---|---|---|---|---|
Purposedifferent | When research notes, feedback, or observations sit unconnected side by side, affinity diagramming sorts the raw material into solid themes. Many individual points turn into patterns that make decisions and opportunities clearer. | When several contexts need to talk to each other, it makes their relationships and dependencies legible. It helps sort integration pressure and responsibilities across system boundaries. | When a problem keeps recurring and the cause stays unclear, the method exposes the underlying mechanism. It separates symptom, guess, and robust explanation from one another. | For a risk that can only be managed through multiple layers of protection, the method examines the effectiveness of each barrier. It shows where safeguards are missing, too weak, or fail under real conditions. |
Complexitydifferent | Low | Medium | Medium | Medium |
Timedifferent | 45–90 min | 1-3 h | 1-4 h | 2-4 h |
Participantsdifferent | 3-10 | 2-8 | 3-8 | 2-6 |
Formatdifferent | Workshop | Workshop + async | Workshop + async | Workshop + async |
Outputdifferent | Theme clusters, Insight statements, Opportunity areas | Context Map, Integration Patterns, Boundary Notes | Problem Statement, Cause Hypotheses, Confirmed Causes, Action Plan | Barrier Inventory, Failure Analysis per Barrier, Action Backlog |
Tagsno overlap | SynthesisQualitativeRoot cause | Domain-Driven DesignBoundariesStrategy | Root causeProblem solvingQualityIncident | Root causeSafetyIncident |