View methods side by side.
Choose up to four methods. Add them using the search and share the comparison by copying its link.
| Criterion |  UX Research Affinity Diagramming | 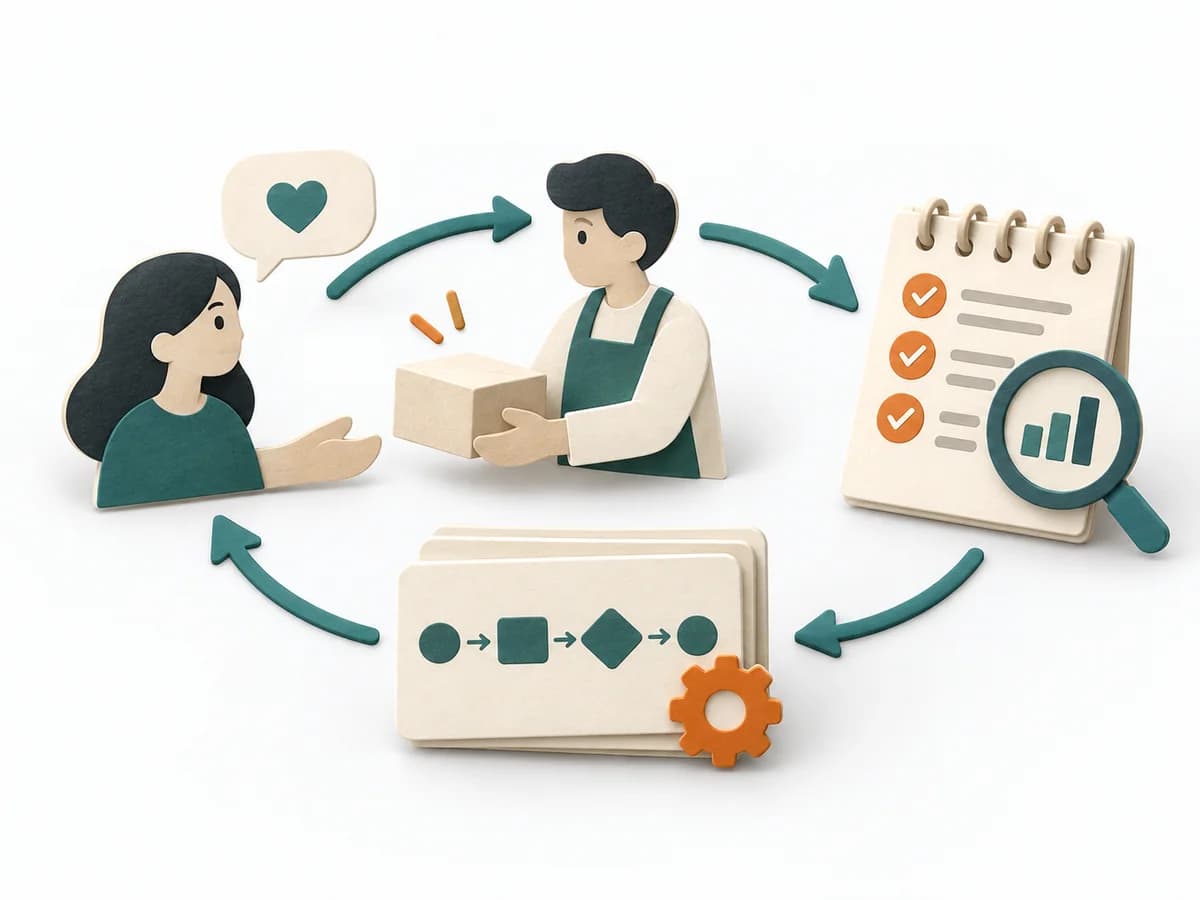 Product Discovery Concierge MVP | 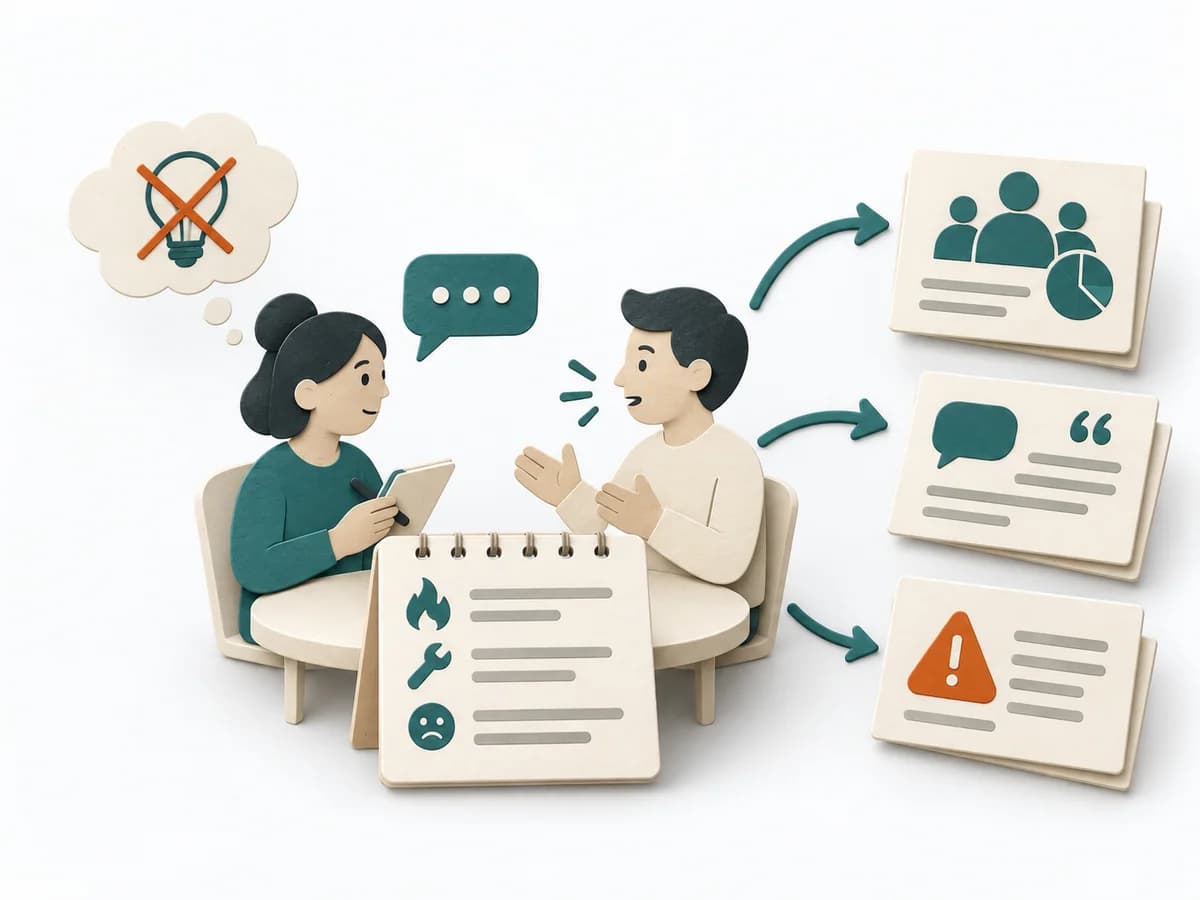 Product Discovery Problem Interview | 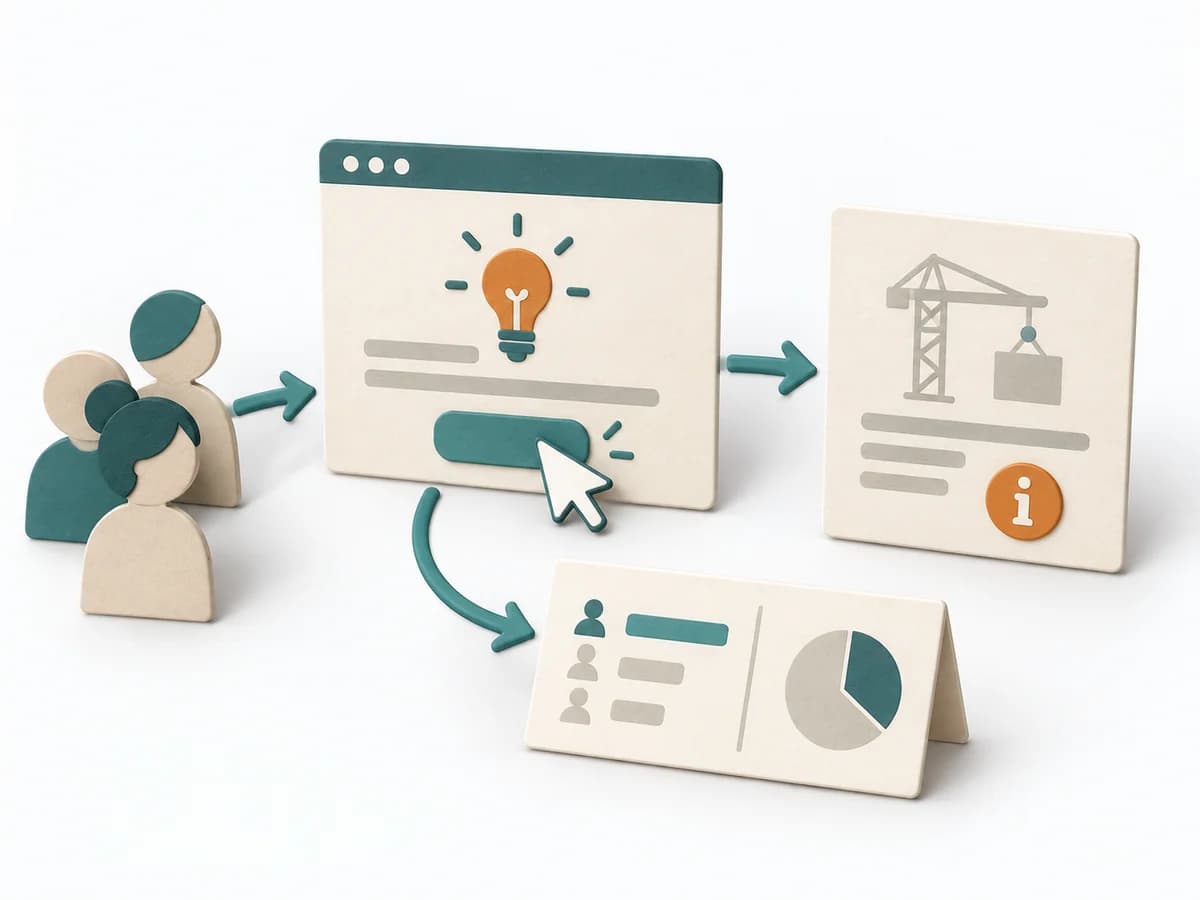 Product Discovery Fake Door Test |
|---|---|---|---|---|
Purposedifferent | When research notes, feedback, or observations sit unconnected side by side, affinity diagramming sorts the raw material into solid themes. Many individual points turn into patterns that make decisions and opportunities clearer. | When an idea can first fail or grow through genuine hands-on support, it relies on manual work instead of automation. It shows whether user value holds up even under manual execution. | When the picture of the problem still needs to become solid, it asks about real situations and consequences. It separates genuine suffering from mere interest in a solution. | When demand is still unclear, it measures interest in a feature before it is built. It separates real behavior from polite agreement and deliberately keeps build effort small. |
Complexitydifferent | Low | Medium | Medium | Medium |
Timedifferent | 45–90 min | 1-4 Wochen | 30-60 min je Interview | 1-5 Tage |
Participantsdifferent | 3-10 | 3-10 Kunden | 5-12 Interviews | Nutzertraffic |
Formatdifferent | Workshop | Workshop + async | Workshop + async | Async |
Outputdifferent | Theme clusters, Insight statements, Opportunity areas | Concierge Learnings, Service Blueprint, MVP Risks | Problem Evidence, Risk Notes, Customer Segments | Click Data, Interest Signal, Learning Decision |
Tagsno overlap | SynthesisQualitativeRoot cause | MVPValidationServiceDiscovery | DiscoveryInterviewsValidation | ValidationExperimentsDemandDiscovery |