View methods side by side.
Choose up to four methods. Add them using the search and share the comparison by copying its link.
| Criterion |  UX Research Affinity Diagramming | 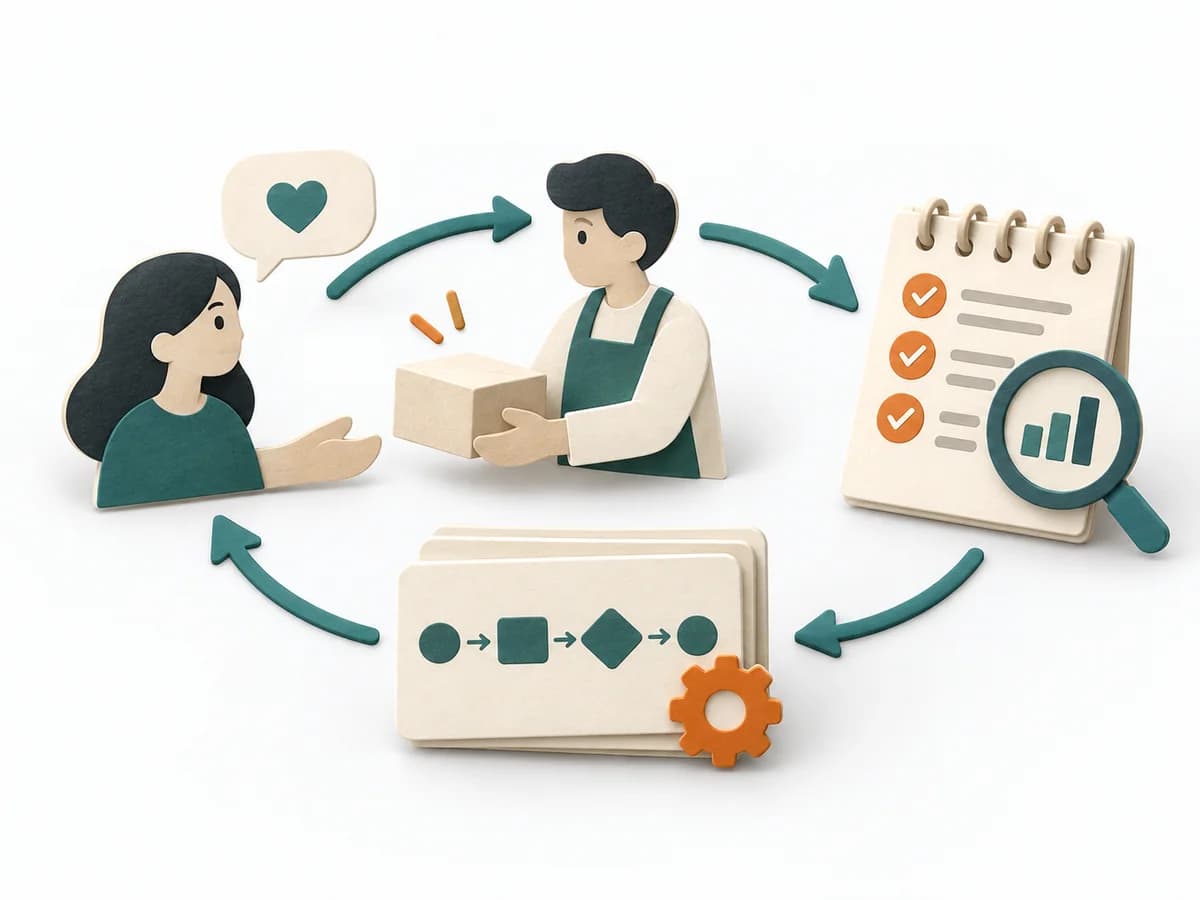 Product Discovery Concierge MVP | 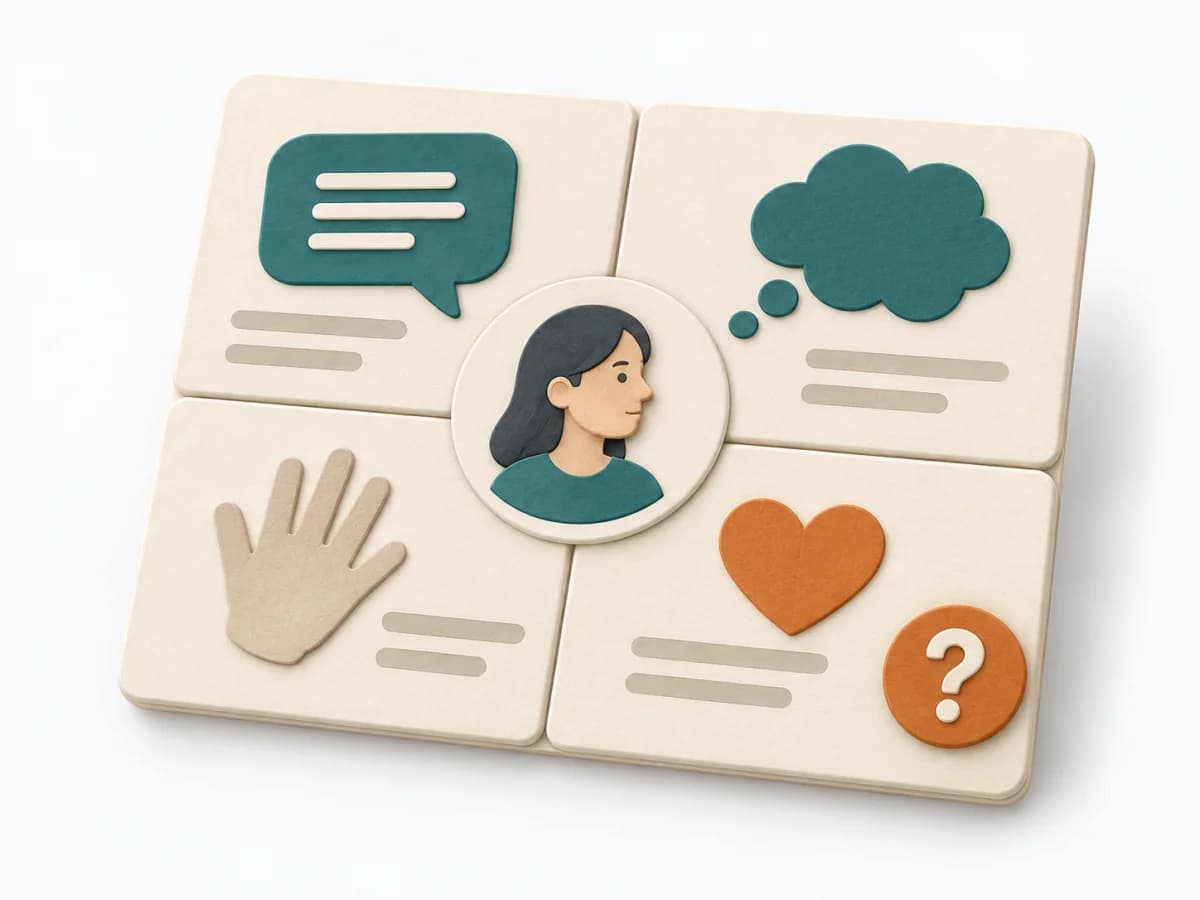 UX Research Empathy Mapping | 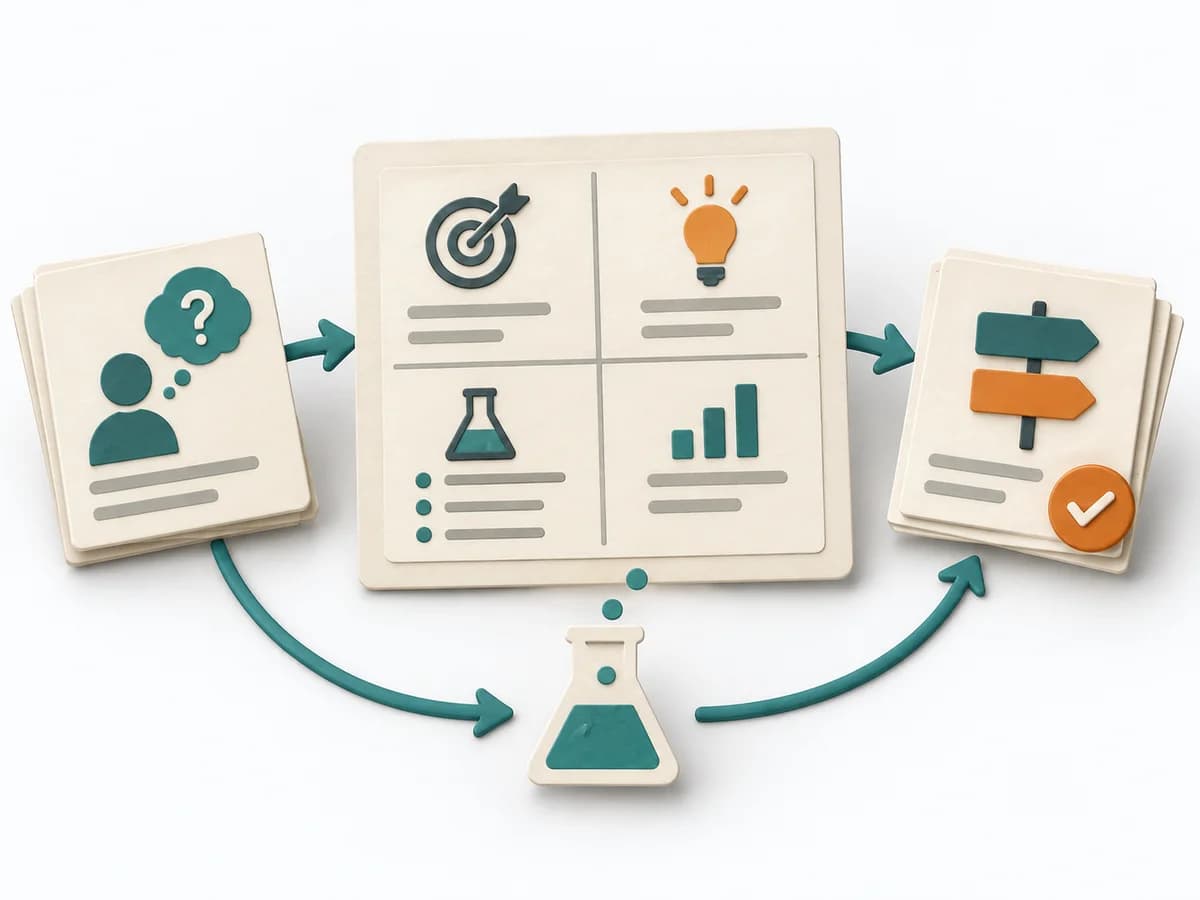 Product Discovery Experiment Canvas |
|---|---|---|---|---|
Purposedifferent | When research notes, feedback, or observations sit unconnected side by side, affinity diagramming sorts the raw material into solid themes. Many individual points turn into patterns that make decisions and opportunities clearer. | When an idea can first fail or grow through genuine hands-on support, it relies on manual work instead of automation. It shows whether user value holds up even under manual execution. | When a lot is assumed about a target group but little is seen jointly, empathy mapping makes knowledge and gaps directly comparable. The picture also shows which assumptions hold up and where evidence is missing. | When experiments become unreadable after the fact, it arranges hypothesis, signal, and learning goal on a single canvas. It separates problem, assumption, solution, and evidence. The result is captured as a Completed Experiment Canvas and a Success Metric. |
Complexitydifferent | Low | Medium | Low | Low |
Timedifferent | 45–90 min | 1-4 Wochen | 30–60 min | 30-60 min |
Participantsdifferent | 3-10 | 3-10 Kunden | 4-8 | 1-5 |
Formatdifferent | Workshop | Workshop + async | Workshop | Workshop + async |
Outputdifferent | Theme clusters, Insight statements, Opportunity areas | Concierge Learnings, Service Blueprint, MVP Risks | Empathy Map, Assumptions List, Research Gaps | Completed Experiment Canvas, Success Metric |
Tagsno overlap | SynthesisQualitativeRoot cause | MVPValidationServiceDiscovery | SynthesisQualitativeWorkshop | ExperimentsValidationDiscoveryHypothesis |