View methods side by side.
Choose up to four methods. Add them using the search and share the comparison by copying its link.
| Criterion |  Operations ABC Analysis |  Agile NoEstimates |  Facilitation Dot Voting | 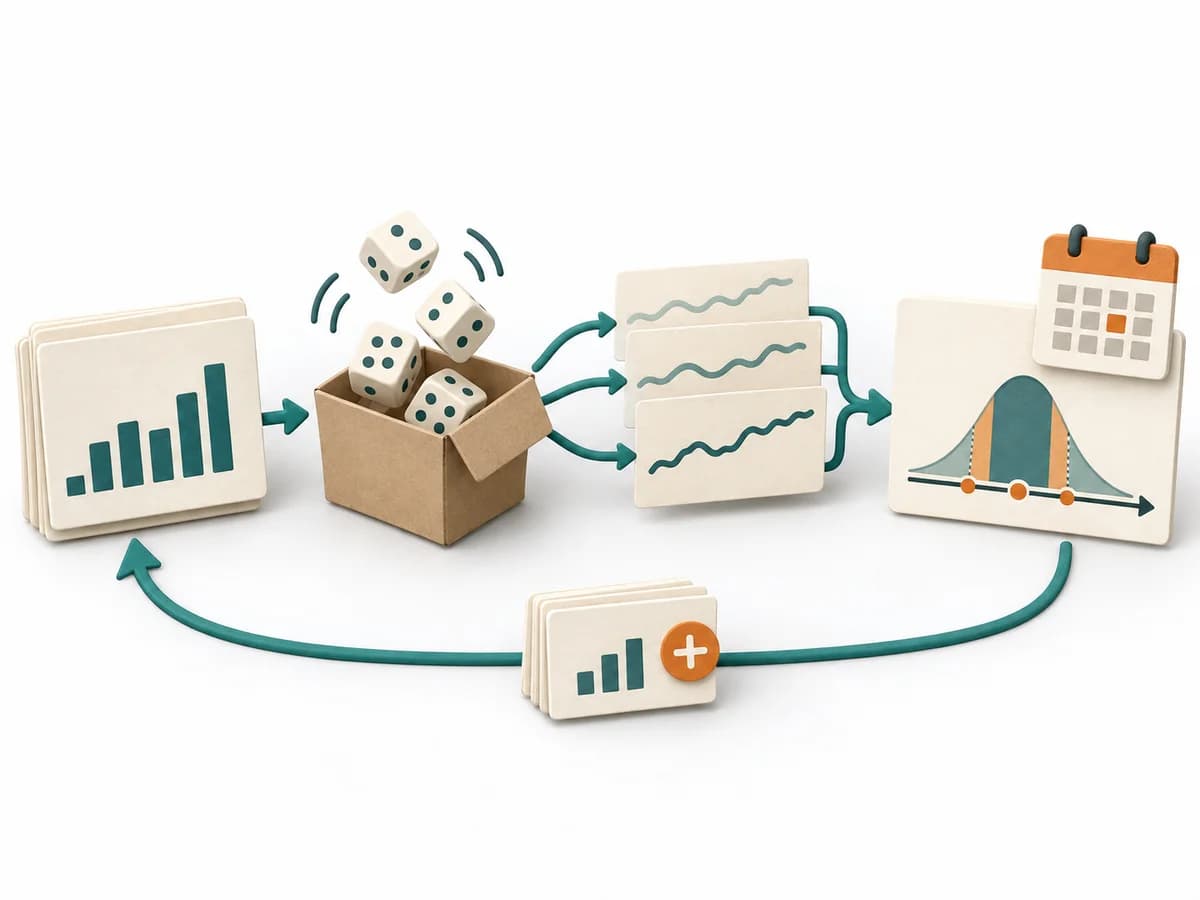 Delivery Monte Carlo Forecasting |
|---|---|---|---|---|
Purposedifferent | With many similar objects of differing economic significance, the method prioritizes effort by effect. It separates what needs regular steering from what rarely needs attention. | When estimating slows a team down more than it helps, it shifts the focus to flow, small slices, and real lead time. It sorts work by value, risk, and delivery ability. The result is captured as Throughput Data, Flow Forecast, and Slicing Rules. | When a workshop has produced too many options and the group needs to condense quickly, dot voting makes preferences visible in a short time. It bundles individual votes into a solid signal for the next selection. | Helps clarify scope, sequence, and delivery flow in concrete terms. It makes work, boundaries, and order steerable. The result is captured as Forecast Percentiles, Throughput Dataset, and Risk Communication. |
Complexitydifferent | Low | Medium | Low | High |
Timedifferent | 30-60 min | laufend | 5-15 min | 30-90 min Setup, danach laufend |
Participantsdifferent | 1-5 | 2-12 | 3-20 | 1-8 |
Formatdifferent | Async | Workshop + async | Workshop | Workshop + async |
Outputdifferent | ABC Classification, Focus Rules, Control List | Throughput Data, Flow Forecast, Slicing Rules | Ranked list, Consensus signal, Shortlist | Forecast Percentiles, Throughput Dataset, Risk Communication |
Tagsno overlap | PrioritizationOperationsPortfolio | EstimationForecastingFlow | FacilitationVotingConsensusPrioritization | ForecastingFlowDelivery |