View methods side by side.
Choose up to four methods. Add them using the search and share the comparison by copying its link.
| Criterion | 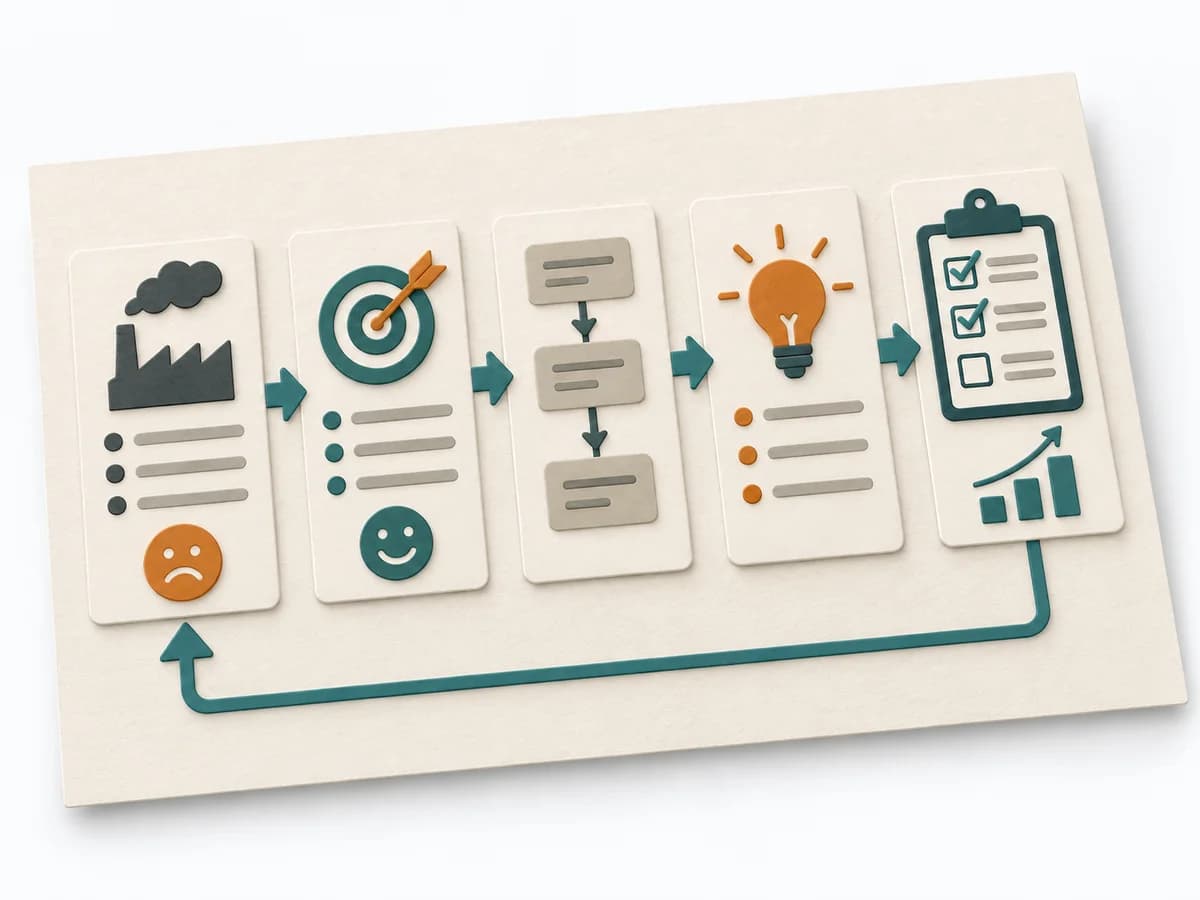 Operations A3 Problem Solving |  Facilitation Dot Estimation |  Product Discovery Assumption Mapping |  Operations 5 Whys |
|---|---|---|---|---|
Purposedifferent | For a complex deviation with several people involved, the method bundles problem, analysis, and decision onto one page. It creates a shared working space where causes, countermeasures, and follow-up fit together. | When size or effort can only be estimated roughly, Dot Estimation condenses the group's experience into a quick range. It turns individual contributions into a visible selection. The result is captured as an Effort Heatmap, Risk Signals, and Discussion Targets. | When assumptions still sit unordered in the room, it weighs uncertainty against leverage. It makes visible which hypotheses should be checked first. | For a single, hard-to-explain deviation, the method exposes the causal chain behind the visible symptom. It keeps the cause open until a controllable condition emerges instead of a mere description. |
Complexitydifferent | Medium | Low | Medium | Low |
Timedifferent | 45-90 min | 5-20 min | 45-60 min | 15-30 min |
Participantsdifferent | 2-5 | 3-20 | 2-8 | 2-6 |
Formatdifferent | Workshop + async | Workshop | Workshop + async | Workshop |
Outputdifferent | A3 Report, Action Plan, Root Cause Analysis | Effort Heatmap, Risk Signals, Discussion Targets | Assumption map, Test backlog, Risk ranking | Root cause notes, Countermeasures |
Tagsno overlap | LeanProblem solvingCoachingOperations | EstimationEffortRisk | AssumptionsRiskExperimentsValidation | Root causeIncidentLeanProblem solving |