View methods side by side.
Choose up to four methods. Add them using the search and share the comparison by copying its link.
| Criterion |  Agile WSJF | 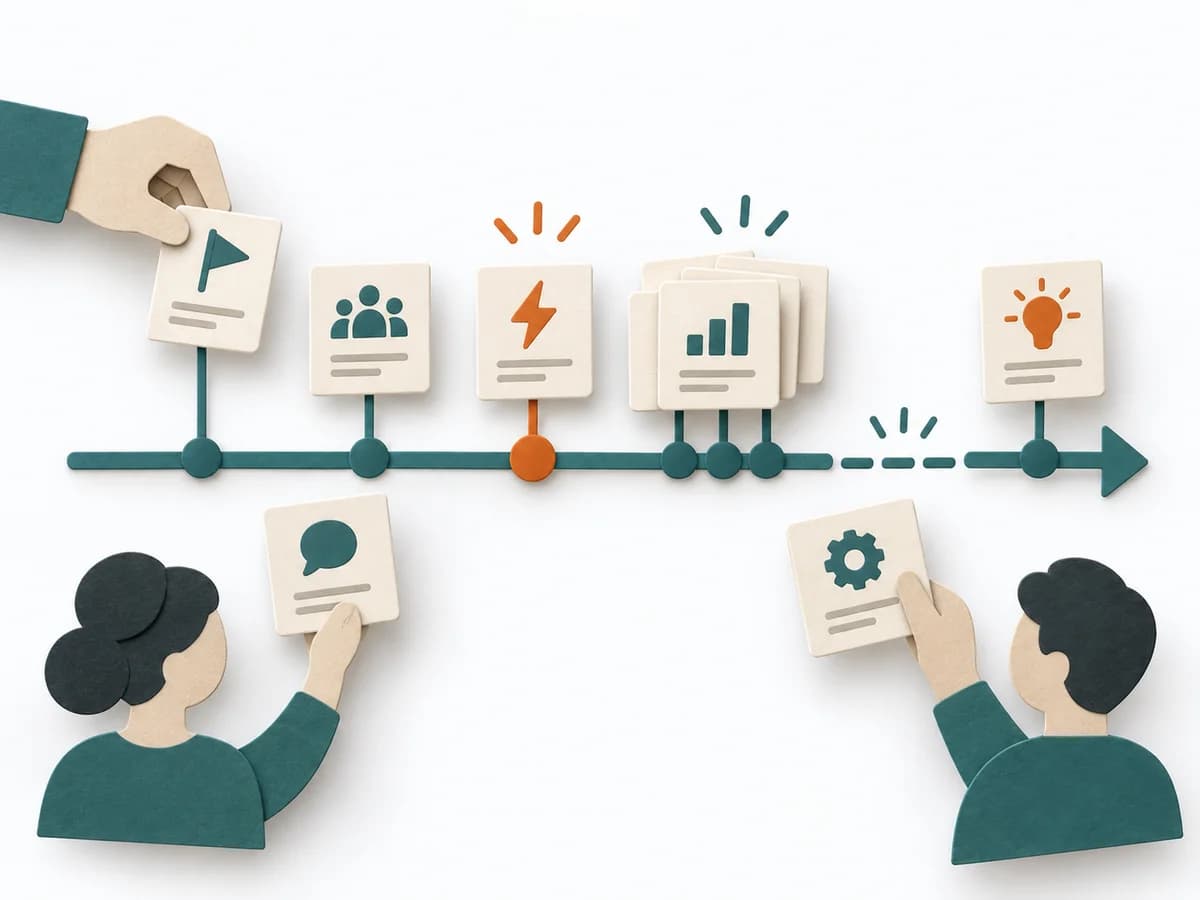 Facilitation Timeline | 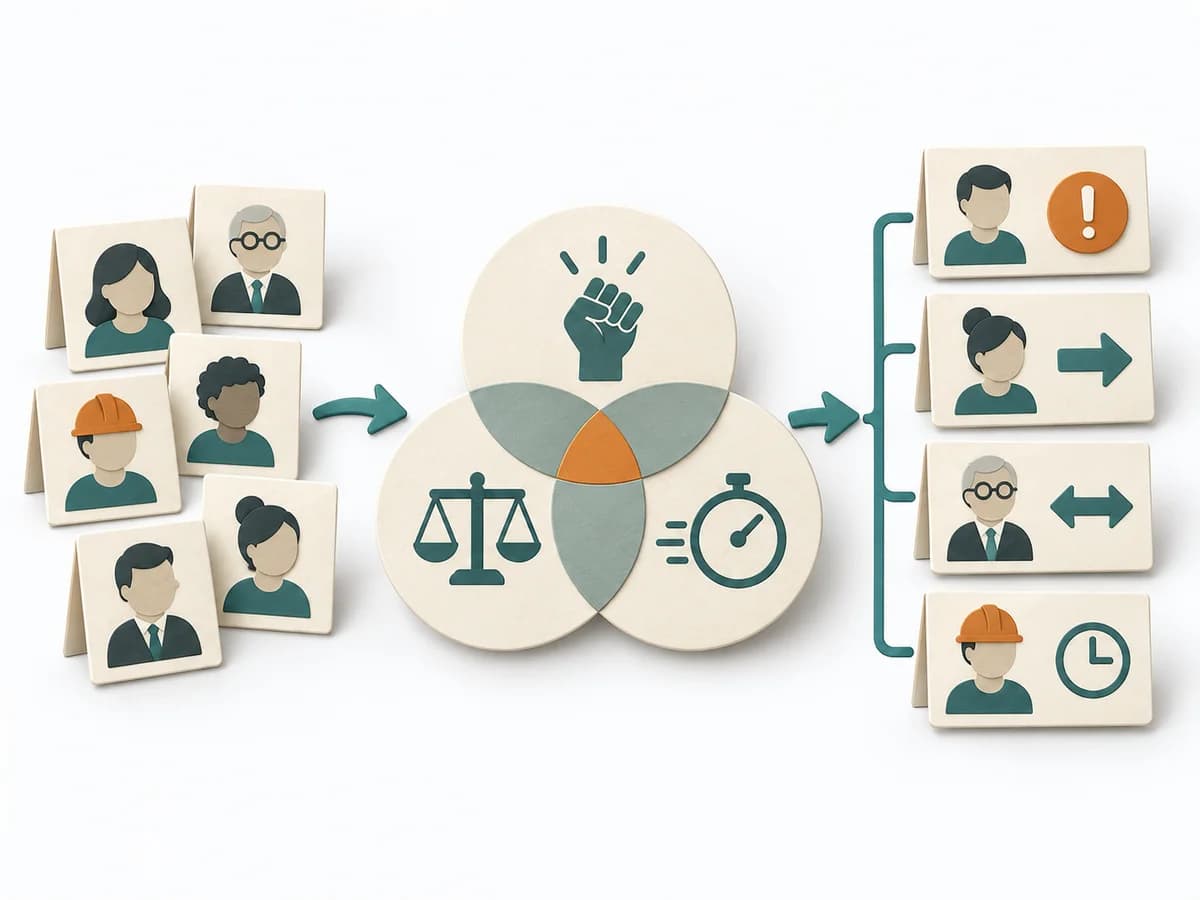 Facilitation Stakeholder Salience Model | 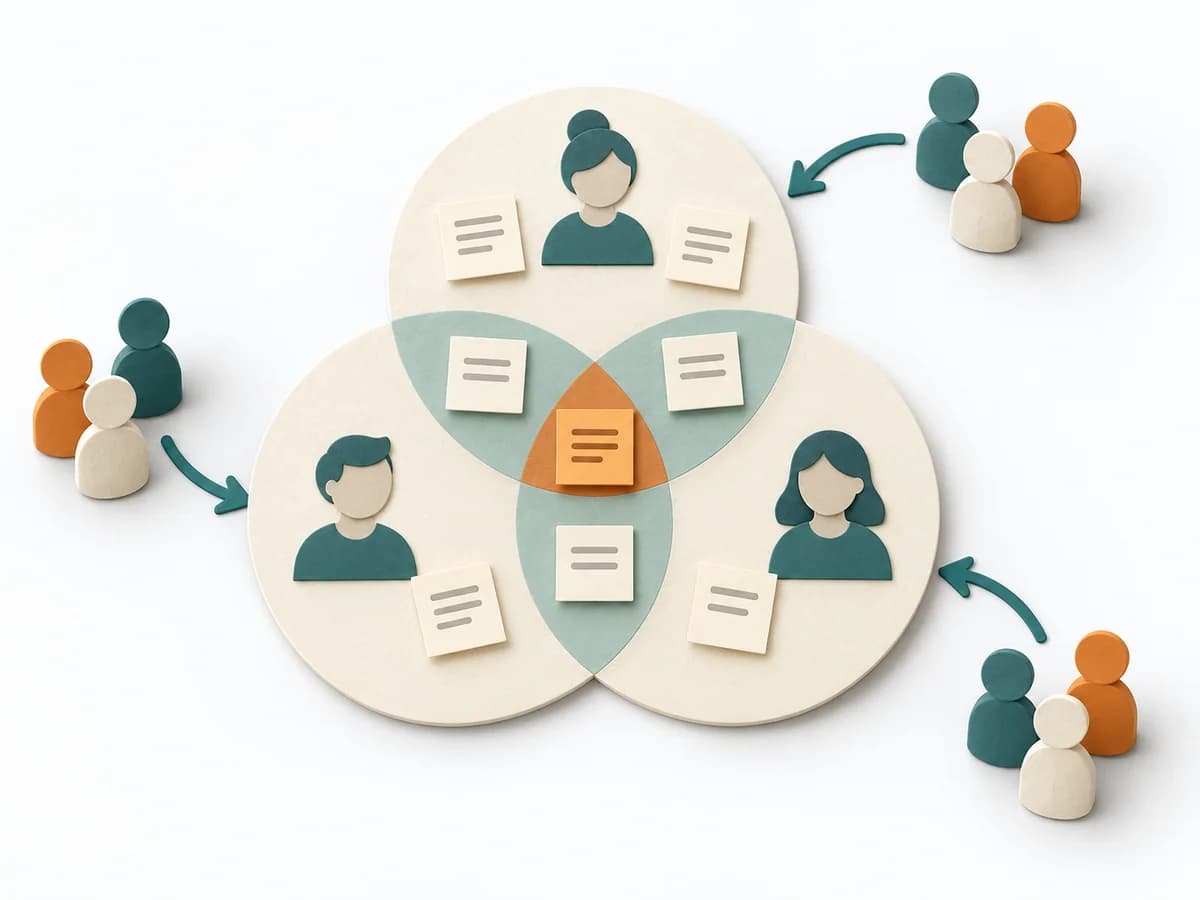 Facilitation 3-Circle Venn Diagram |
|---|---|---|---|---|
Purposedifferent | When many tasks compete for the same capacity, it orders work by economic impact. It makes time lost, benefit, and effort comparable together. | When a project, incident, or change process is only remembered in fragments, Timeline brings the sequence back into a readable form. It makes turning points, precursors, and after-effects recognizable over the course of time. | When stakeholders appear to matter very differently, the Stakeholder Salience Model rates their actual priority through power, legitimacy, and urgency. It turns individual contributions into a visible selection. The result is captured as a Salience diagram and a class-based strategy. | When three perspectives matter at the same time, a Three-Circle Venn Diagram shows the overlaps and remainders precisely. It makes visible where shared effect arises and where only a partial perspective applies. |
Complexitydifferent | High | Low | Medium | Low |
Timedifferent | 45-90 min | 30-90 min | 60-90 min | 15-45 min |
Participantsdifferent | 3-10 | 2-12 | 3-6 | 2-8 |
Formatdifferent | Workshop | Workshop + async | Workshop | Workshop + async |
Outputdifferent | Ranked Backlog, Cost-of-Delay Assumptions | Timeline, Milestones, Insight Notes | Salience Diagram, Strategy per Class | Venn Diagram, Overlap Notes, Differentiators |
Tagsno overlap | LeanEconomicsSequencePrioritization | TimelineFacilitationSequence | StakeholdersFacilitationAlignmentGovernance | ComparisonFacilitationAlignment |