View methods side by side.
Choose up to four methods. Add them using the search and share the comparison by copying its link.
| Criterion |  Agile WSJF | 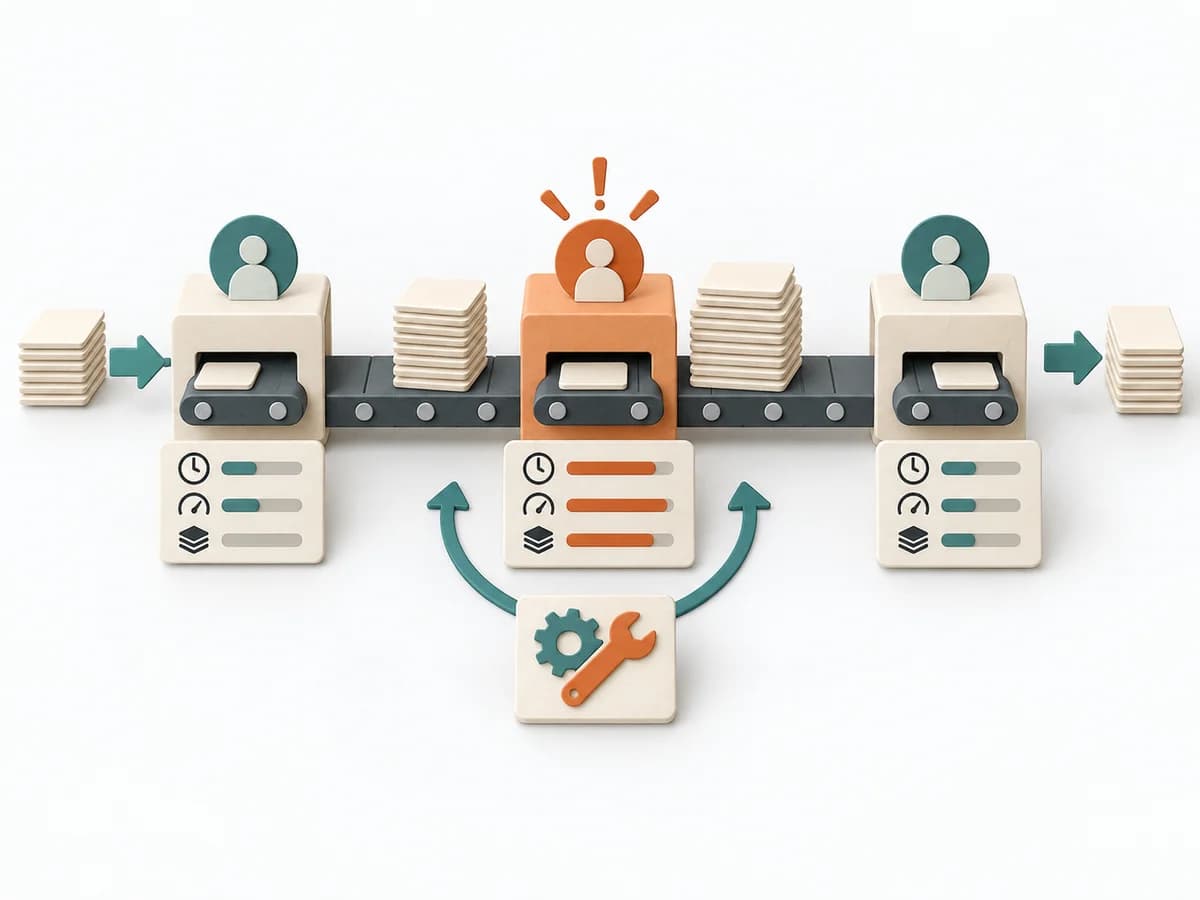 Operations Bottleneck Analysis | 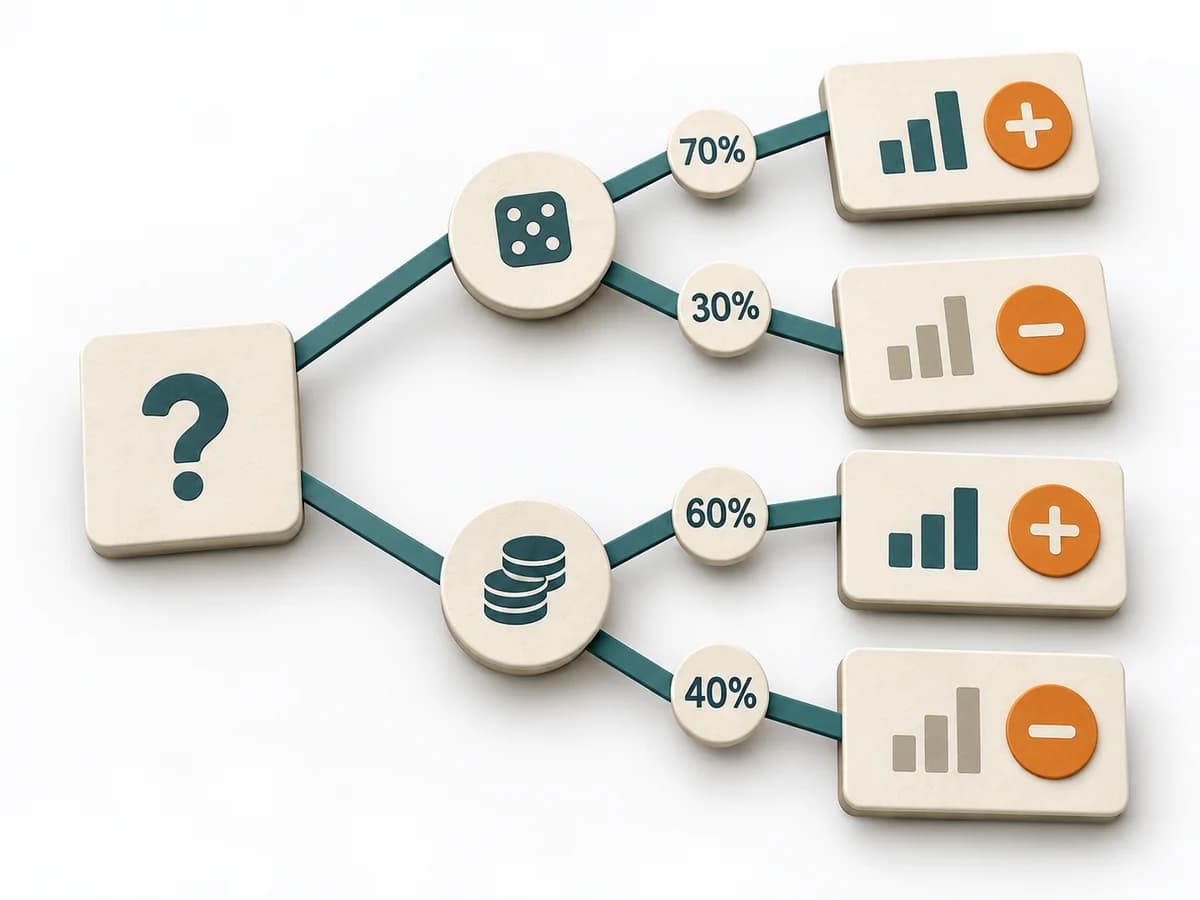 Decision Making Decision Tree |  Delivery MoSCoW |
|---|---|---|---|---|
Purposedifferent | When many tasks compete for the same capacity, it orders work by economic impact. It makes time lost, benefit, and effort comparable together. | For a flow that backs up at one point, the method looks for the capacity limit with the greatest leverage. It explains why extra effort elsewhere barely improves throughput. | For decisions with follow-on paths and dependencies, a linear comparison is often not enough. A Decision Tree shows how options branch under conditions and which consequences hang on each branch. | When a release carries too many demands and priorities are only ever negotiated, MoSCoW creates clear boundaries for the next cut. Must, Should, Could, and Won't make commitment, room for maneuver, and trade-off logic visible to everyone involved. |
Complexitydifferent | High | Medium | Medium | Low |
Timedifferent | 45-90 min | 1-3 h | 30-90 min | 30-90 min |
Participantsdifferent | 3-10 | 3-8 | 1-6 | 3-12 |
Formatdifferent | Workshop | Workshop + async | Workshop + async | Workshop + async |
Outputdifferent | Ranked Backlog, Cost-of-Delay Assumptions | Bottleneck Map, Flow Metrics, Improvement Options, Follow-up Measures | Decision Tree, Option Map, Assumption List | Prioritized Backlog, Release Scope, Tradeoff Notes |
Tagsno overlap | LeanEconomicsSequencePrioritization | FlowMeasurementConstraints | DecisionTreeOptions | PrioritizationScopeDecision |