View methods side by side.
Choose up to four methods. Add them using the search and share the comparison by copying its link.
| Criterion |  Operations Visual Management | 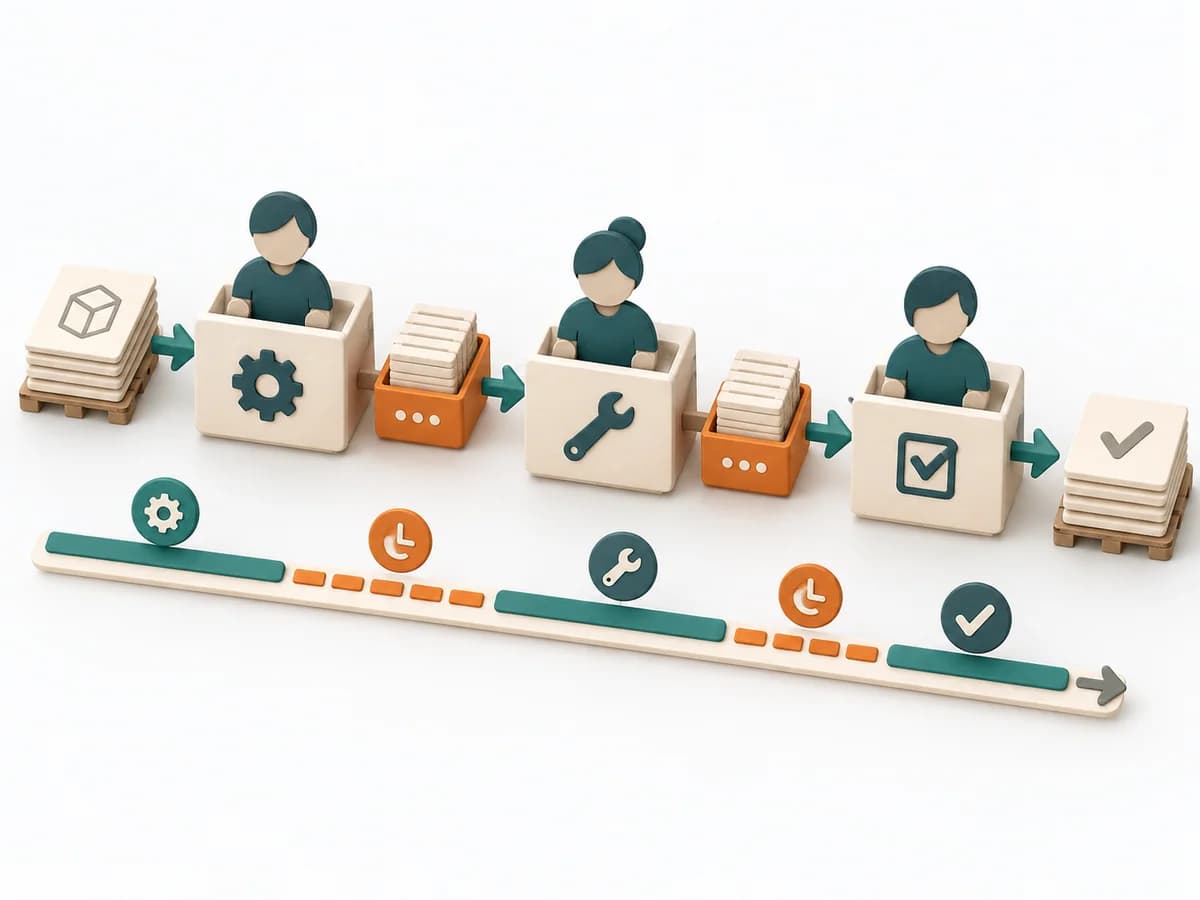 Delivery Value Stream Mapping | 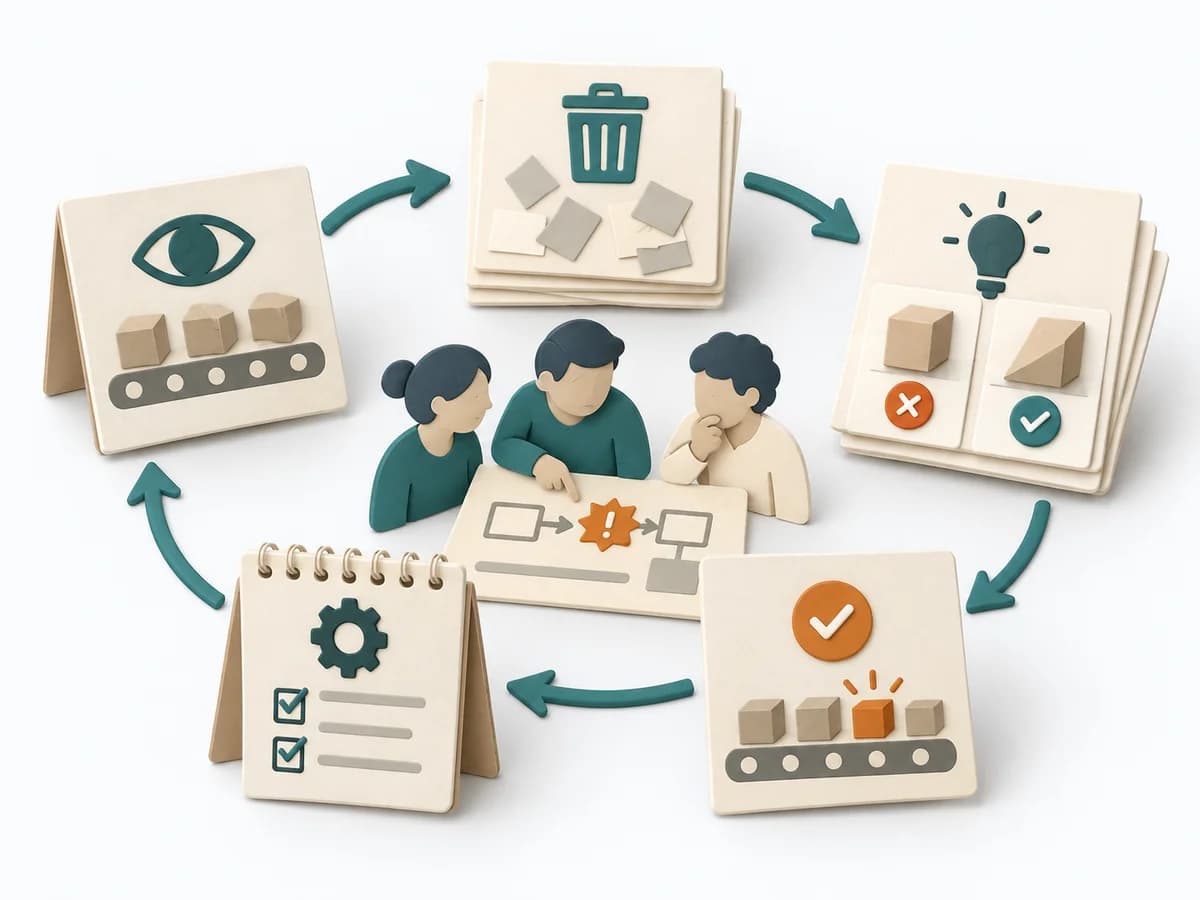 Operations Kaizen Event | 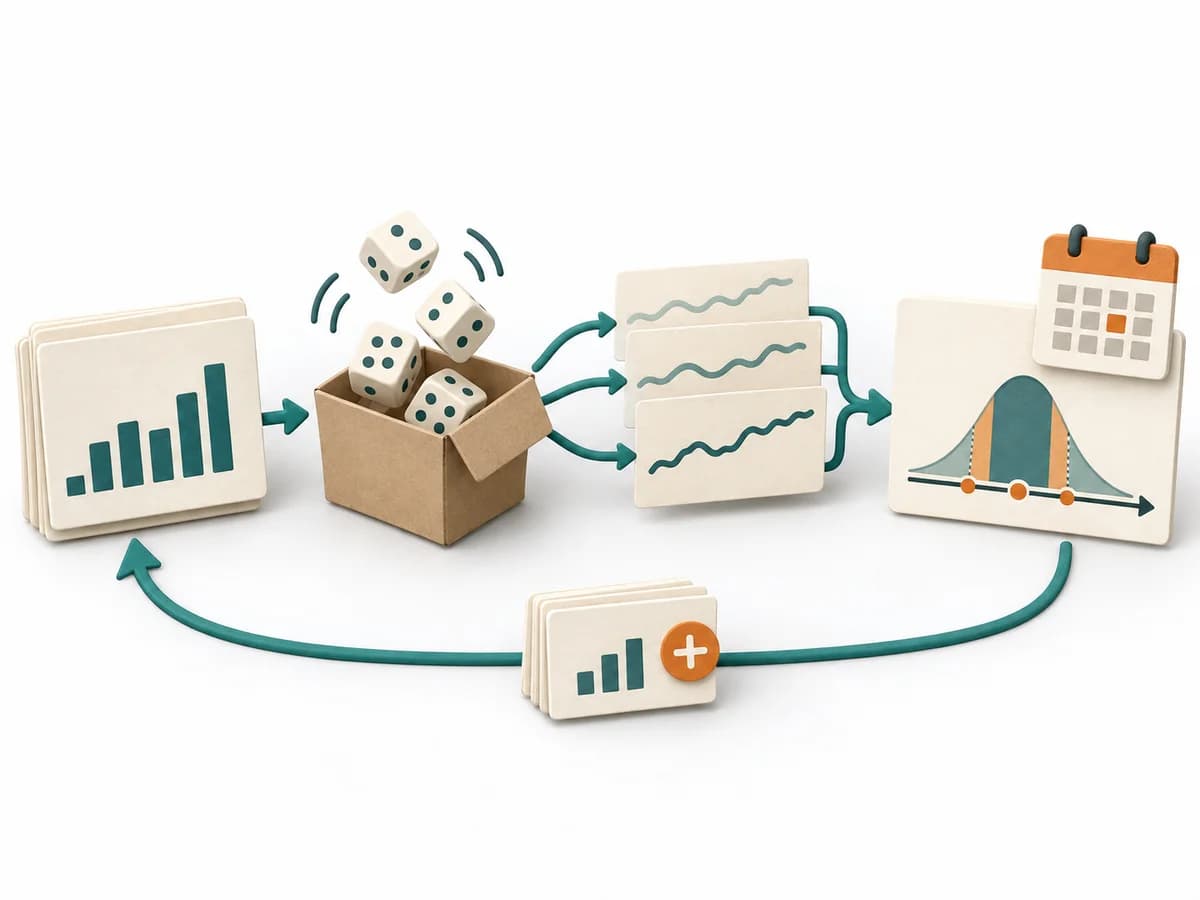 Delivery Monte Carlo Forecasting |
|---|---|---|---|---|
Purposedifferent | With high tempo and many parallel topics, the method makes status, deviations, and priorities visible at a glance. It reduces search effort and prevents what matters from getting lost in daily work. | When delivery work dissolves into wait times, handoffs, and hidden effort, Value Stream Mapping makes the actual flow visible. The method exposes bottlenecks, idle time, and feedback loops so lead time and improvement levers become tangible. | For a tightly scoped process segment with noticeable waste, the method bundles shared energy for change. It suits situations that call for fast learning loops and visible adjustments. | Helps clarify scope, sequence, and delivery flow in concrete terms. It makes work, boundaries, and order steerable. The result is captured as Forecast Percentiles, Throughput Dataset, and Risk Communication. |
Complexitydifferent | Low | Medium | Medium | High |
Timedifferent | Ongoing | 1-3 h | 0.5-5 Tage | 30-90 min Setup, danach laufend |
Participantsdifferent | 1-20 | 4-10 | 4-10 | 1-8 |
Formatdifferent | Workshop + async | Workshop | Workshop | Workshop + async |
Outputdifferent | Visual Board, Status Indicators, Exception Cues | Current-state map, Future-state map, Bottleneck list | Kaizen Charter, Waste List, Improvement Experiments, Standard Work Update | Forecast Percentiles, Throughput Dataset, Risk Communication |
Tagsno overlap | SignalsOperationsVisual management | LeanFlowWasteDelivery | LeanContinuous improvementOperations | ForecastingFlowDelivery |