View methods side by side.
Choose up to four methods. Add them using the search and share the comparison by copying its link.
| Criterion |  Operations Visual Management | 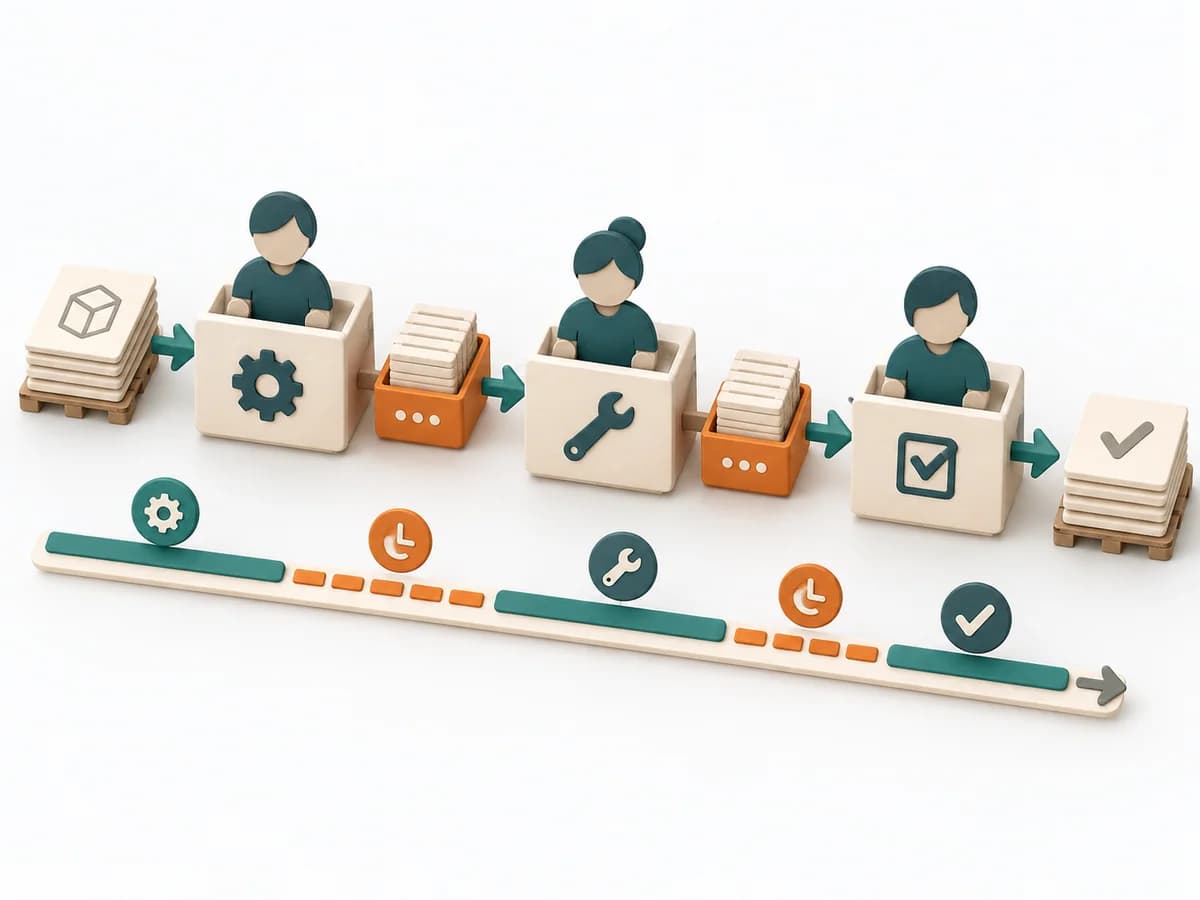 Delivery Value Stream Mapping | 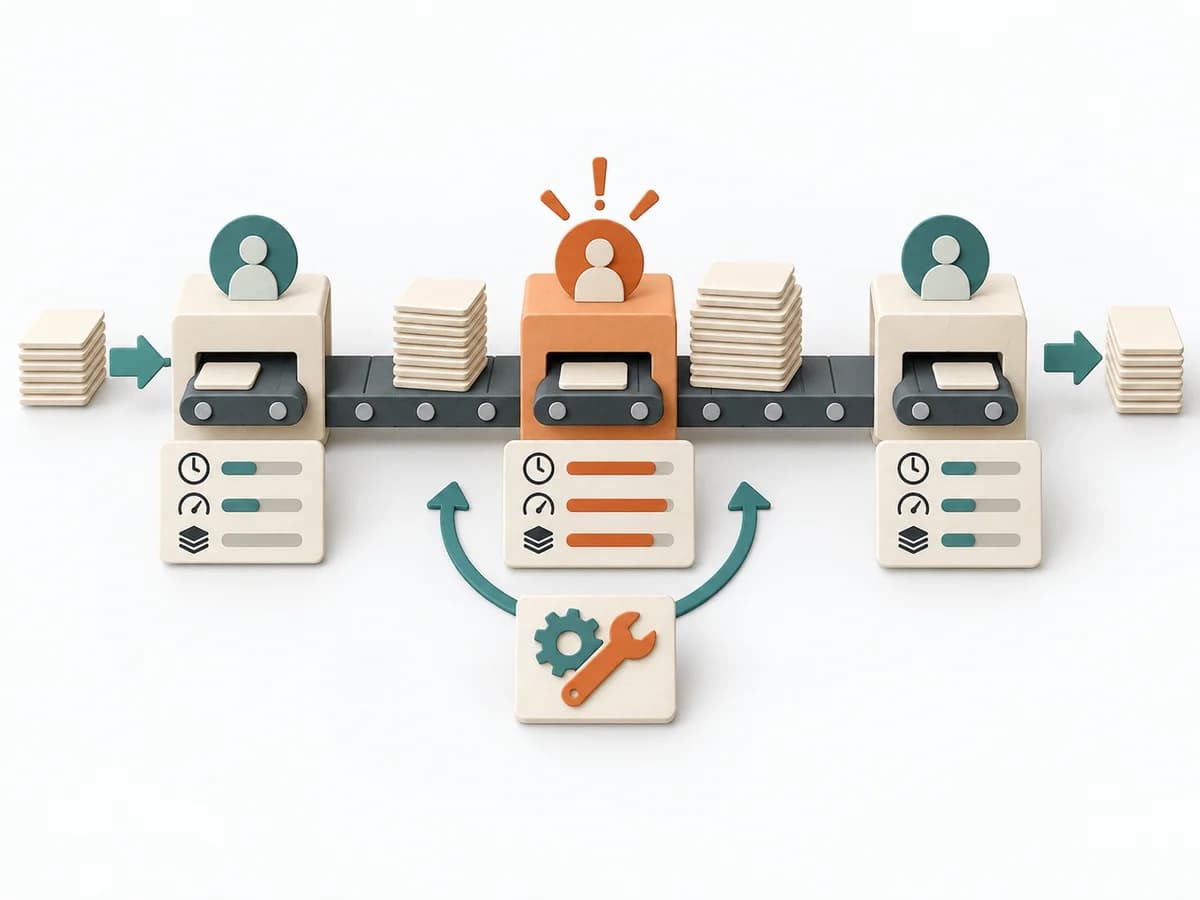 Operations Bottleneck Analysis | 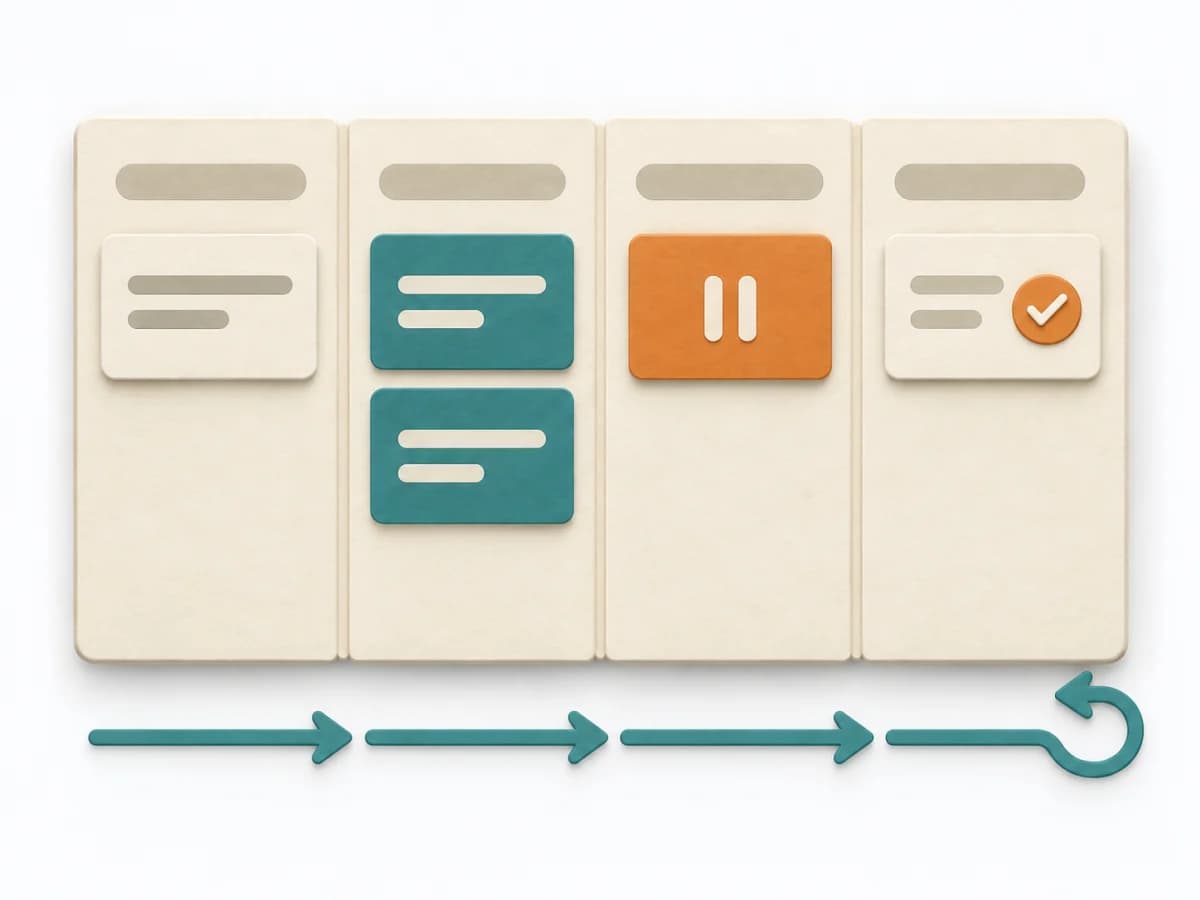 Engineering Kanban |
|---|---|---|---|---|
Purposedifferent | With high tempo and many parallel topics, the method makes status, deviations, and priorities visible at a glance. It reduces search effort and prevents what matters from getting lost in daily work. | When delivery work dissolves into wait times, handoffs, and hidden effort, Value Stream Mapping makes the actual flow visible. The method exposes bottlenecks, idle time, and feedback loops so lead time and improvement levers become tangible. | For a flow that backs up at one point, the method looks for the capacity limit with the greatest leverage. It explains why extra effort elsewhere barely improves throughput. | When work sits in too many parallel streams, throughput suffers and no one sees the bottlenecks. Kanban makes the flow of work visible and limits overload so a system becomes calmer and more predictable. |
Complexitydifferent | Low | Medium | Medium | Medium |
Timedifferent | Ongoing | 1-3 h | 1-3 h | Ongoing |
Participantsdifferent | 1-20 | 4-10 | 3-8 | 2-12 |
Formatdifferent | Workshop + async | Workshop | Workshop + async | Workshop + async |
Outputdifferent | Visual Board, Status Indicators, Exception Cues | Current-state map, Future-state map, Bottleneck list | Bottleneck Map, Flow Metrics, Improvement Options, Follow-up Measures | Kanban board, WIP policies, Flow metrics |
Tagsno overlap | SignalsOperationsVisual management | LeanFlowWasteDelivery | FlowMeasurementConstraints | FlowVisual managementDelivery |