View methods side by side.
Choose up to four methods. Add them using the search and share the comparison by copying its link.
| Criterion |  Operations Visual Management |  Facilitation 3-Circle Venn Diagram |  Facilitation Power Interest Grid | 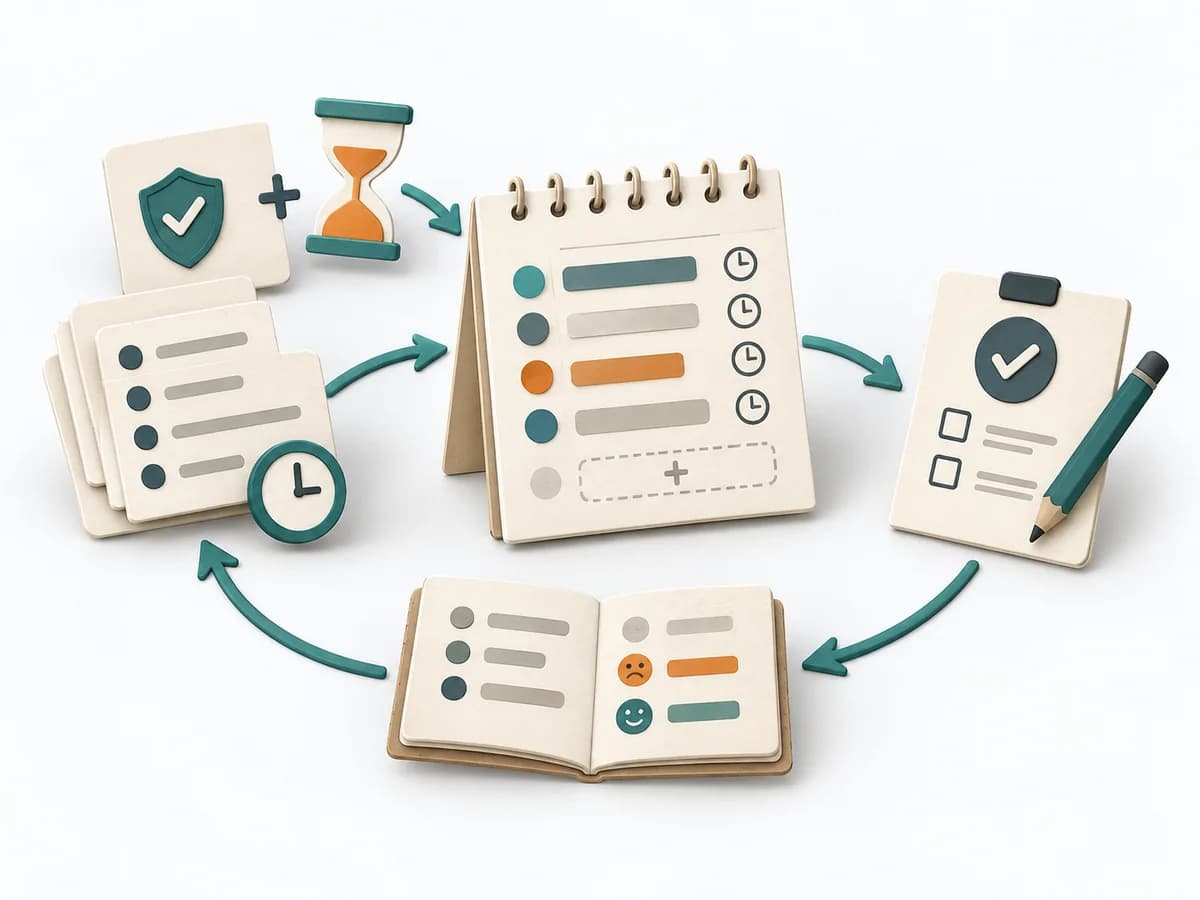 Operations ALPEN Method |
|---|---|---|---|---|
Purposedifferent | With high tempo and many parallel topics, the method makes status, deviations, and priorities visible at a glance. It reduces search effort and prevents what matters from getting lost in daily work. | When three perspectives matter at the same time, a Three-Circle Venn Diagram shows the overlaps and remainders precisely. It makes visible where shared effect arises and where only a partial perspective applies. | When many stakeholders compete for attention at once, the Power Interest Grid sorts them by influence and stake. It turns individual contributions into a visible selection. The result is captured as a Power Interest Grid and a stakeholder-specific strategy. | With an overloaded day full of too many tasks, a realistic picture of the day emerges. The method connects estimating, deciding, and buffer thinking so planning fits available energy and time. |
Complexitysame | Low | Low | Low | Low |
Timedifferent | Ongoing | 15-45 min | 30-60 min | 10-20 min daily |
Participantsdifferent | 1-20 | 2-8 | 2-8 | 1 |
Formatdifferent | Workshop + async | Workshop + async | Workshop | Async |
Outputdifferent | Visual Board, Status Indicators, Exception Cues | Venn Diagram, Overlap Notes, Differentiators | Power Interest Grid, Strategy per Stakeholder | Daily Plan, Time Estimates, Review Notes |
Tagsno overlap | SignalsOperationsVisual management | ComparisonFacilitationAlignment | StakeholdersFacilitationAlignmentPlanning | PlanningTime managementProductivityOperations |