View methods side by side.
Choose up to four methods. Add them using the search and share the comparison by copying its link.
| Criterion |  Operations Visual Management | 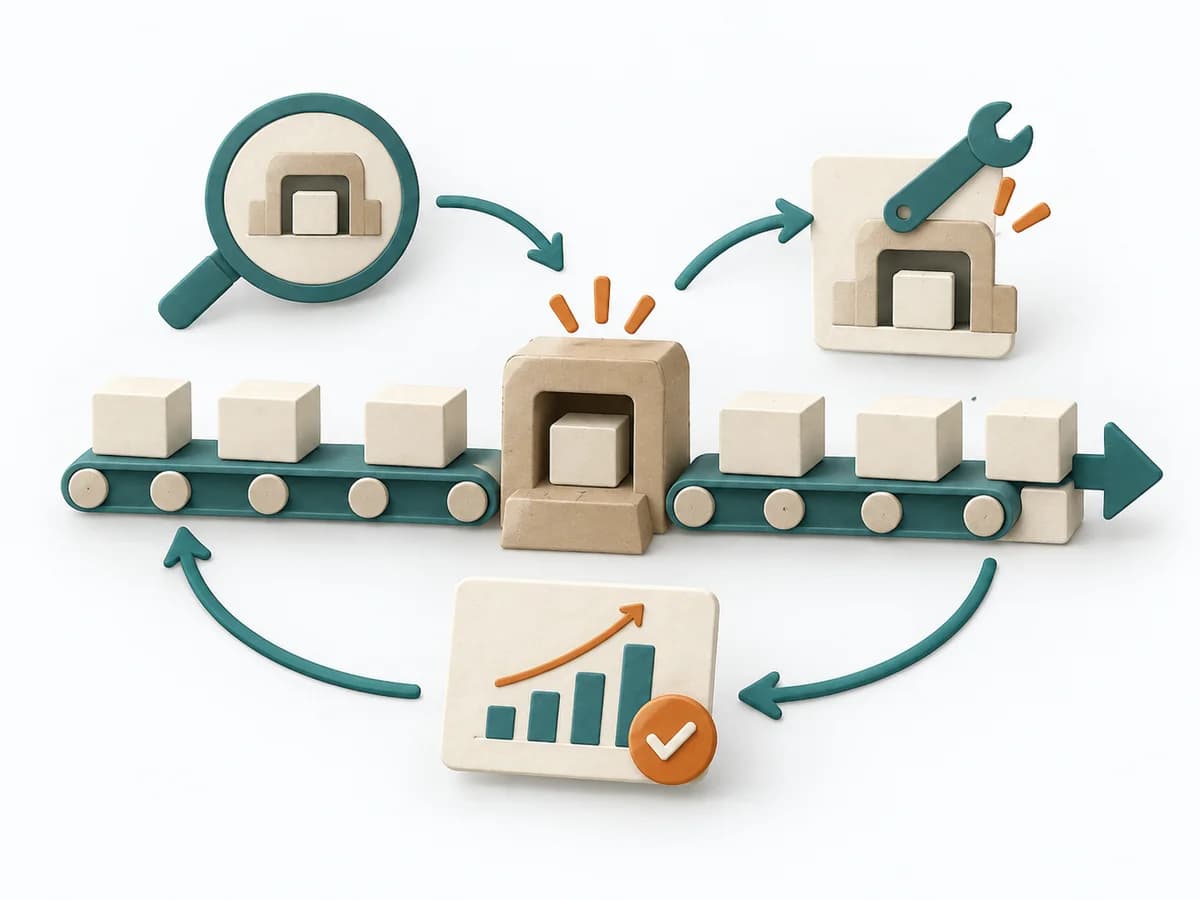 Operations Theory of Constraints |  Operations Process Mapping |  Operations Bottleneck Analysis |
|---|---|---|---|---|
Purposedifferent | With high tempo and many parallel topics, the method makes status, deviations, and priorities visible at a glance. It reduces search effort and prevents what matters from getting lost in daily work. | For a system that does not get faster despite effort, the method directs attention to the bottleneck. It concentrates improvement on the point that actually limits throughput. | With a confusing workflow that has many handoffs, the method makes the actual process visible. It shows where work is passed on, delayed, or duplicated, so improvement targets the right spots. | For a flow that backs up at one point, the method looks for the capacity limit with the greatest leverage. It explains why extra effort elsewhere barely improves throughput. |
Complexitydifferent | Low | High | Medium | Medium |
Timedifferent | Ongoing | 2-4 h Analyse, laufend | 1-3 h | 1-3 h |
Participantsdifferent | 1-20 | 3-12 | 3-10 | 3-8 |
Formatdifferent | Workshop + async | Workshop + async | Workshop | Workshop + async |
Outputdifferent | Visual Board, Status Indicators, Exception Cues | Constraint Map, Improvement Plan, Flow Metrics | Process Map, Handoff List, Improvement Backlog | Bottleneck Map, Flow Metrics, Improvement Options, Follow-up Measures |
Tagsno overlap | SignalsOperationsVisual management | OperationsConstraintsFlowImprovement | ProcessOperationsImprovement | FlowMeasurementConstraints |