View methods side by side.
Choose up to four methods. Add them using the search and share the comparison by copying its link.
| Criterion |  Operations Visual Management | 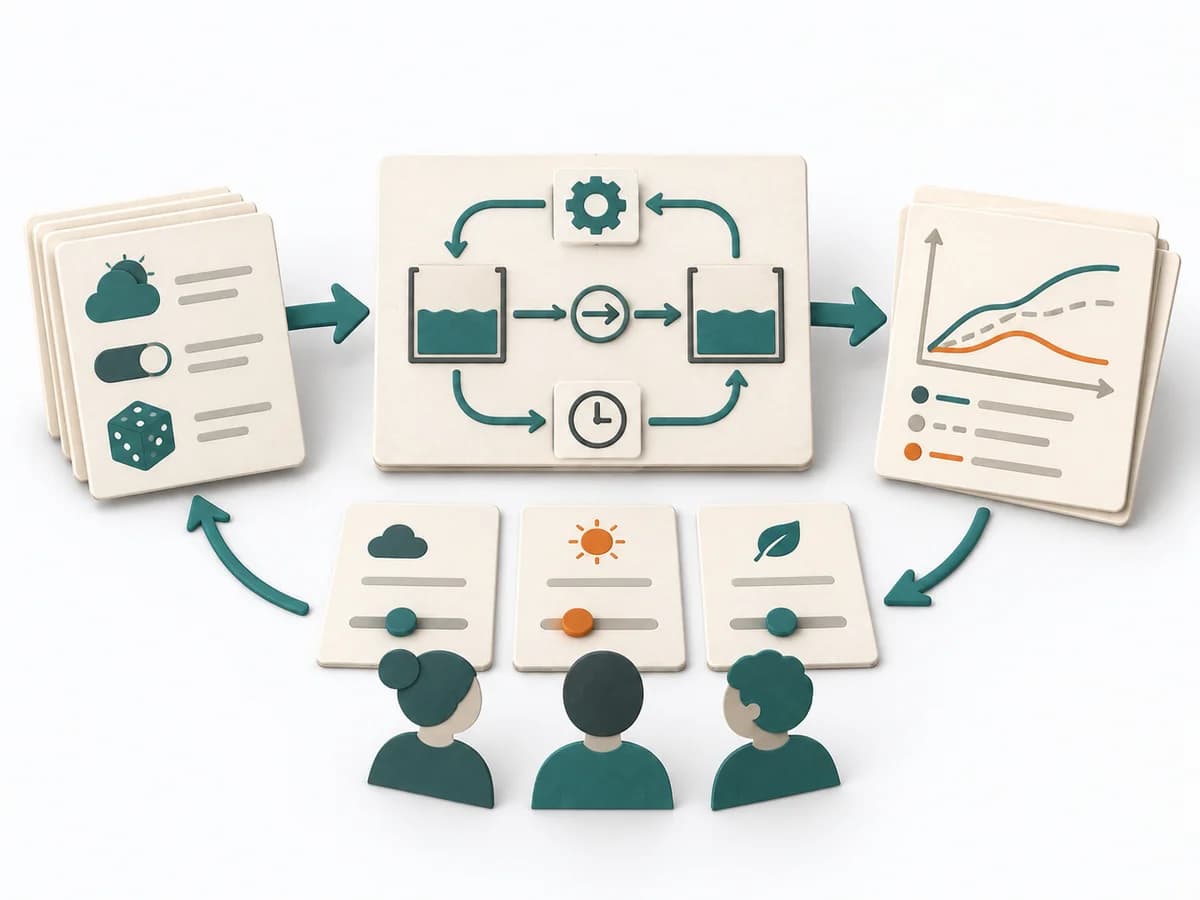 Systems Thinking System Dynamics Simulation |  Systems Thinking Causal Loop Diagram | 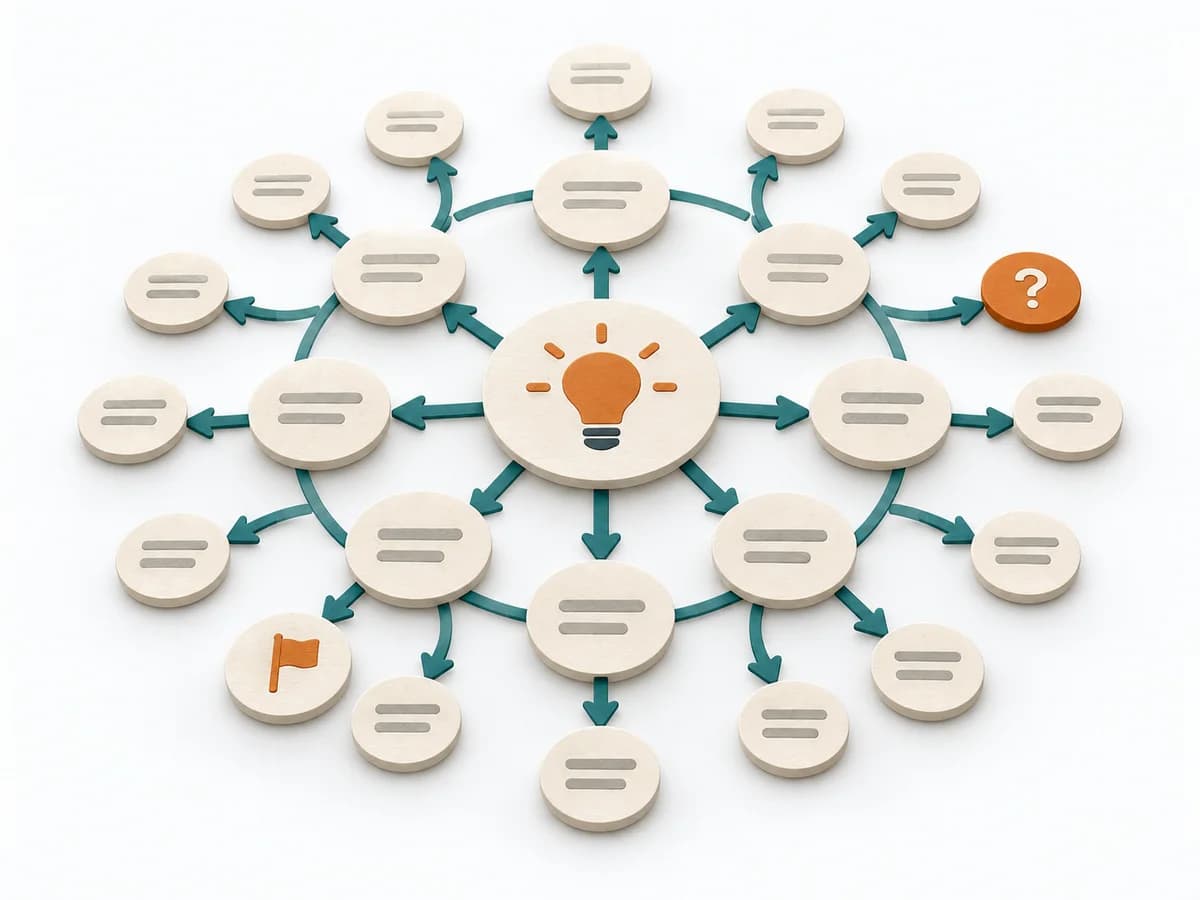 Systems Thinking Futures Wheel |
|---|---|---|---|---|
Purposedifferent | With high tempo and many parallel topics, the method makes status, deviations, and priorities visible at a glance. It reduces search effort and prevents what matters from getting lost in daily work. | System Dynamics Simulation makes assumptions about time, delay, and feedback testable through experiments. It draws relationships, patterns, and feedback loops. The result is captured as a simulation model and scenario reports. | A Causal Loop Diagram makes feedback, reinforcement, and balance in a system legible. It uncovers side effects and self-reinforcement that stay hidden in linear explanations. | The Futures Wheel helps explore the consequences of a decision, a trend, or a strategic move in a structured way. It makes visible which first, second, and third-order effects could arise from an event. |
Complexitydifferent | Low | High | Medium | Medium |
Timedifferent | Ongoing | Mehrere Tage bis Wochen | 1-3 h | 60-120 min |
Participantsdifferent | 1-20 | 1-5 Modellierende, Stakeholder asynchron | 2-8 | 3-10 |
Formatdifferent | Workshop + async | Async | Workshop | Workshop + async |
Outputdifferent | Visual Board, Status Indicators, Exception Cues | Simulation Model, Scenario Reports | Causal Loop Diagram, Feedback Notes, Leverage Points | Futures Wheel, Consequence Chains, Strategic Signals |
Tagsno overlap | SignalsOperationsVisual management | Systems thinkingDynamicsSimulationAnalysis | FeedbackSystems thinkingCausalityDynamics | ForesightSystems thinkingSignals |