View methods side by side.
Choose up to four methods. Add them using the search and share the comparison by copying its link.
| Criterion |  Operations Visual Management |  Operations Process Mapping | 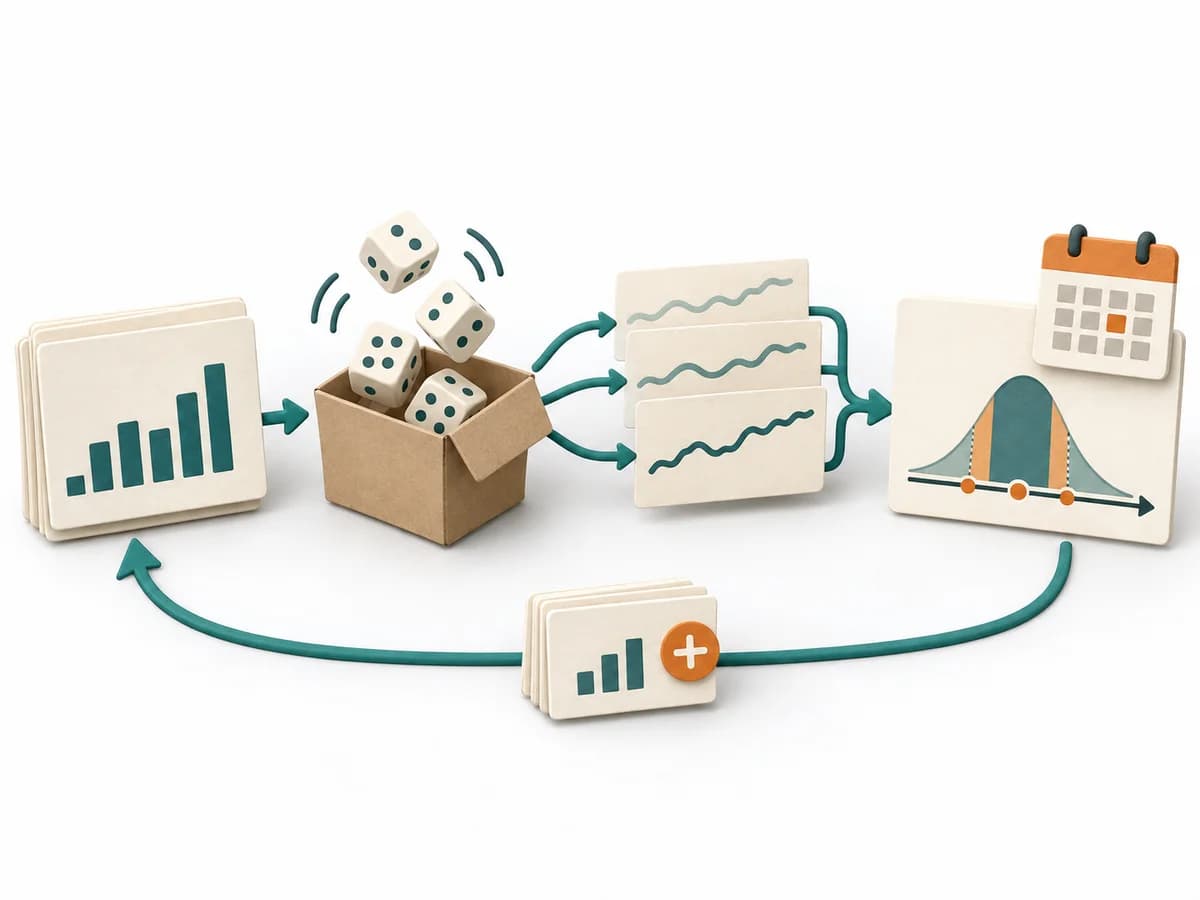 Delivery Monte Carlo Forecasting | 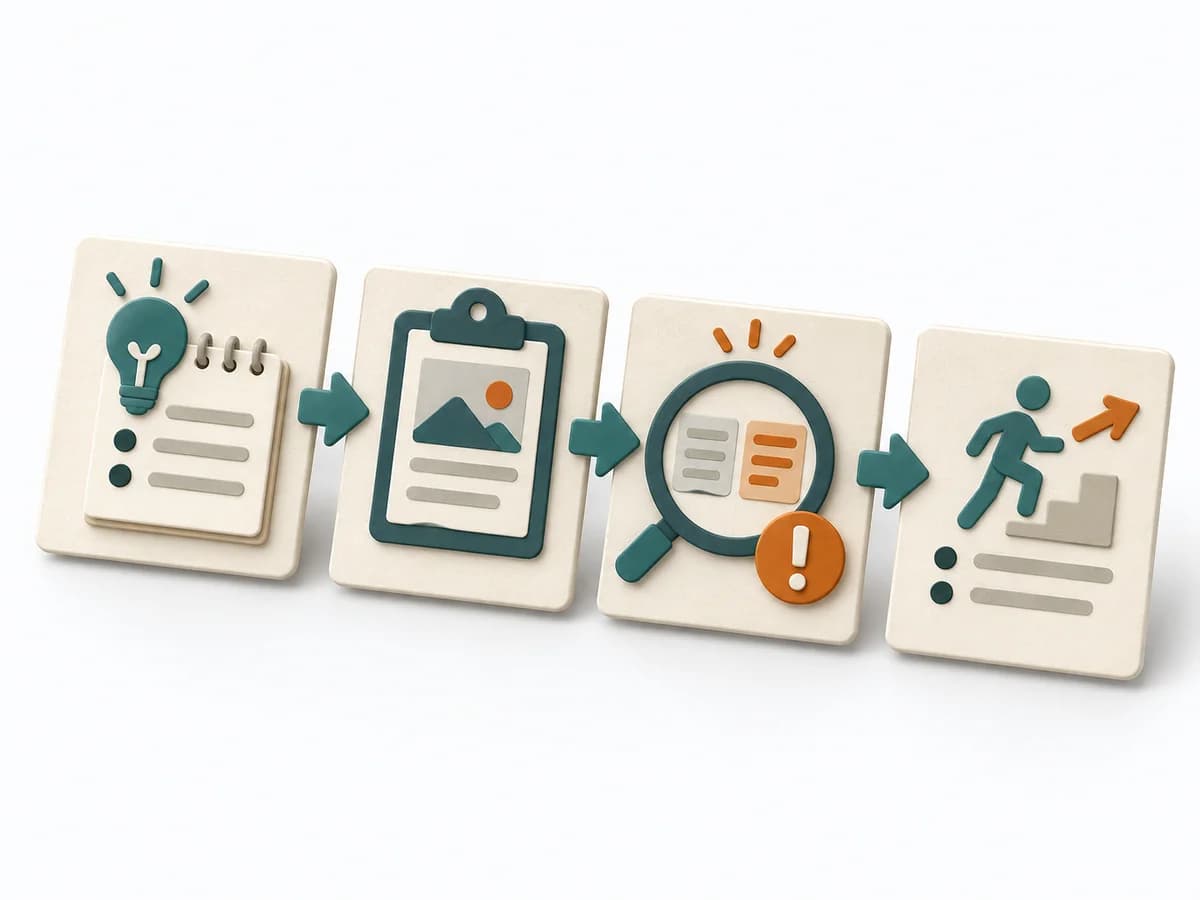 Operations After-Action Review |
|---|---|---|---|---|
Purposedifferent | With high tempo and many parallel topics, the method makes status, deviations, and priorities visible at a glance. It reduces search effort and prevents what matters from getting lost in daily work. | With a confusing workflow that has many handoffs, the method makes the actual process visible. It shows where work is passed on, delayed, or duplicated, so improvement targets the right spots. | Helps clarify scope, sequence, and delivery flow in concrete terms. It makes work, boundaries, and order steerable. The result is captured as Forecast Percentiles, Throughput Dataset, and Risk Communication. | After missions or project phases with unclear outcomes, the method makes visible what actually happened and what can be learned from it. It separates course, effect, and causes so experience turns into solid improvement. |
Complexitydifferent | Low | Medium | High | Low |
Timedifferent | Ongoing | 1-3 h | 30-90 min Setup, danach laufend | 20-45 min |
Participantsdifferent | 1-20 | 3-10 | 1-8 | 3-12 |
Formatdifferent | Workshop + async | Workshop | Workshop + async | Workshop + async |
Outputdifferent | Visual Board, Status Indicators, Exception Cues | Process Map, Handoff List, Improvement Backlog | Forecast Percentiles, Throughput Dataset, Risk Communication | Lessons learned, Action items, Event summary |
Tagsno overlap | SignalsOperationsVisual management | ProcessOperationsImprovement | ForecastingFlowDelivery | LearningOperationsImprovement |