View methods side by side.
Choose up to four methods. Add them using the search and share the comparison by copying its link.
| Criterion |  Operations Visual Management |  Growth Pirate Metrics AARRR |  Growth A/B Testing | 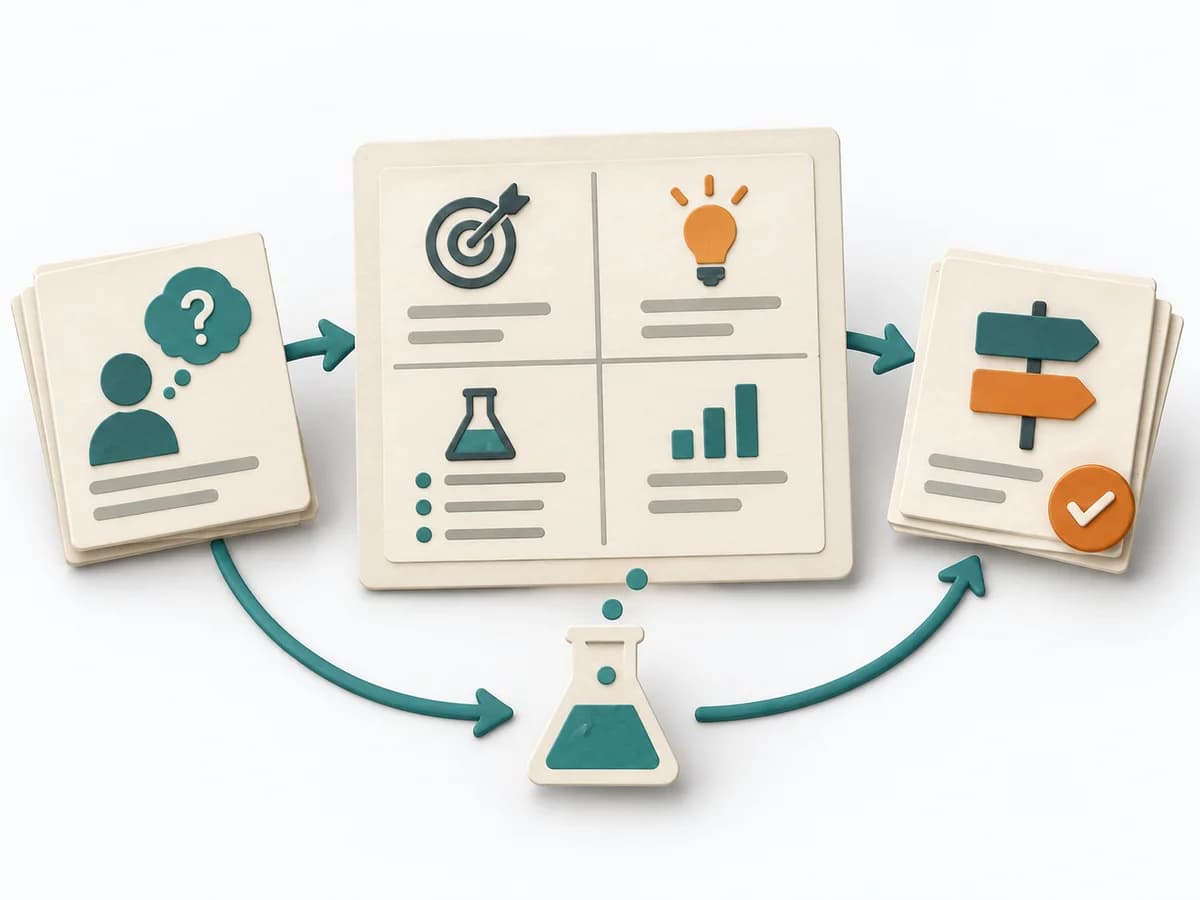 Product Discovery Experiment Canvas |
|---|---|---|---|---|
Purposedifferent | With high tempo and many parallel topics, the method makes status, deviations, and priorities visible at a glance. It reduces search effort and prevents what matters from getting lost in daily work. | For products with complex usage paths, overall growth alone is too coarse to reveal bottlenecks. Pirate Metrics breaks the relationship with the product into consecutive stages and shows where the funnel actually leaks. | When two variants compete, discussions quickly decide by taste rather than effect. A/B Testing checks behavior under controlled conditions and separates real improvement from chance or expectation effects. | When experiments become unreadable after the fact, it arranges hypothesis, signal, and learning goal on a single canvas. It separates problem, assumption, solution, and evidence. The result is captured as a Completed Experiment Canvas and a Success Metric. |
Complexitydifferent | Low | Medium | High | Low |
Timedifferent | Ongoing | 1-2 h Setup, laufend | 1-4 Wochen | 30-60 min |
Participantsdifferent | 1-20 | 2-8 | 1-6 | 1-5 |
Formatdifferent | Workshop + async | Workshop + async | Async | Workshop + async |
Outputdifferent | Visual Board, Status Indicators, Exception Cues | AARRR funnel, Metric baseline, Experiment backlog | Experiment results, Decision log, Learning summary | Completed Experiment Canvas, Success Metric |
Tagsno overlap | SignalsOperationsVisual management | GrowthMetricsExperiments | ExperimentsGrowthAnalyticsValidation | ExperimentsValidationDiscoveryHypothesis |