View methods side by side.
Choose up to four methods. Add them using the search and share the comparison by copying its link.
| Criterion |  Operations Visual Management | 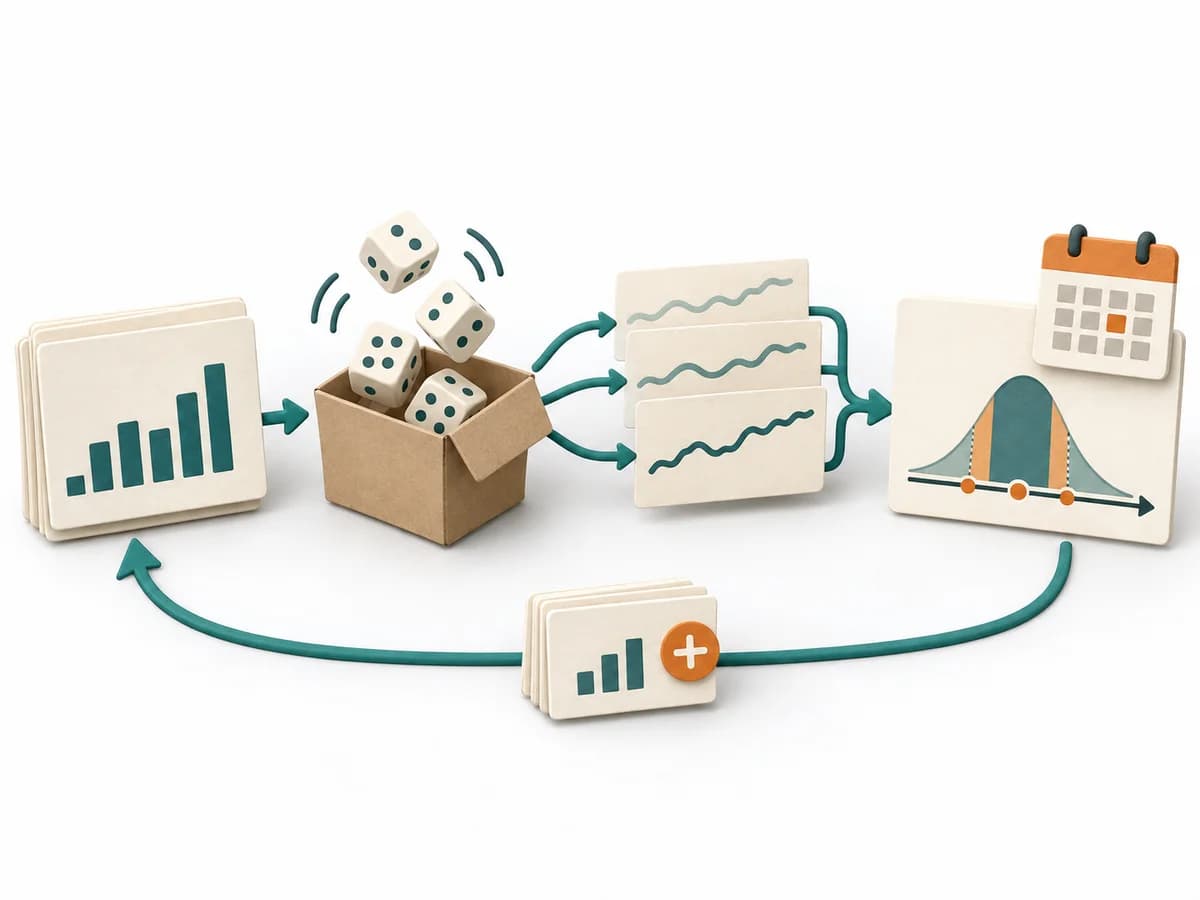 Delivery Monte Carlo Forecasting | 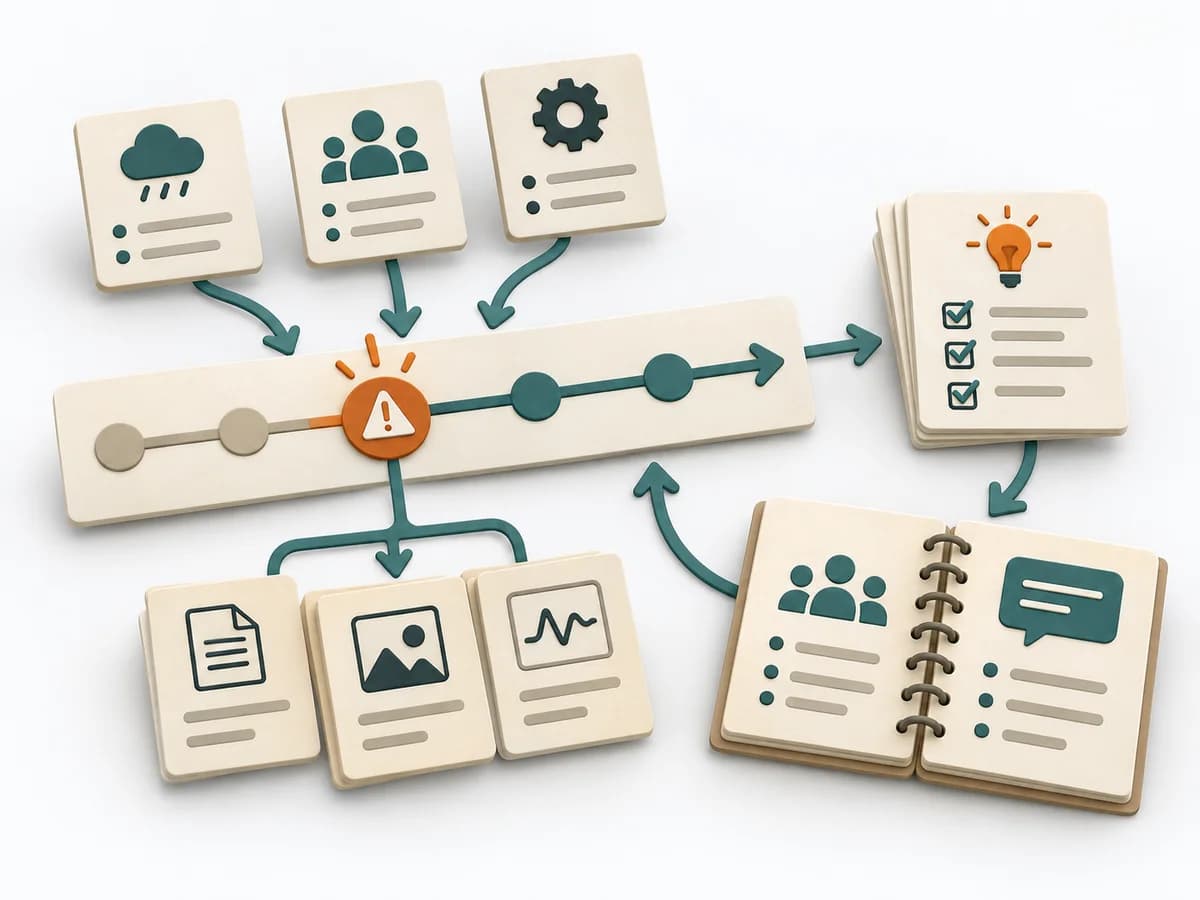 DevOps Blameless Postmortem | 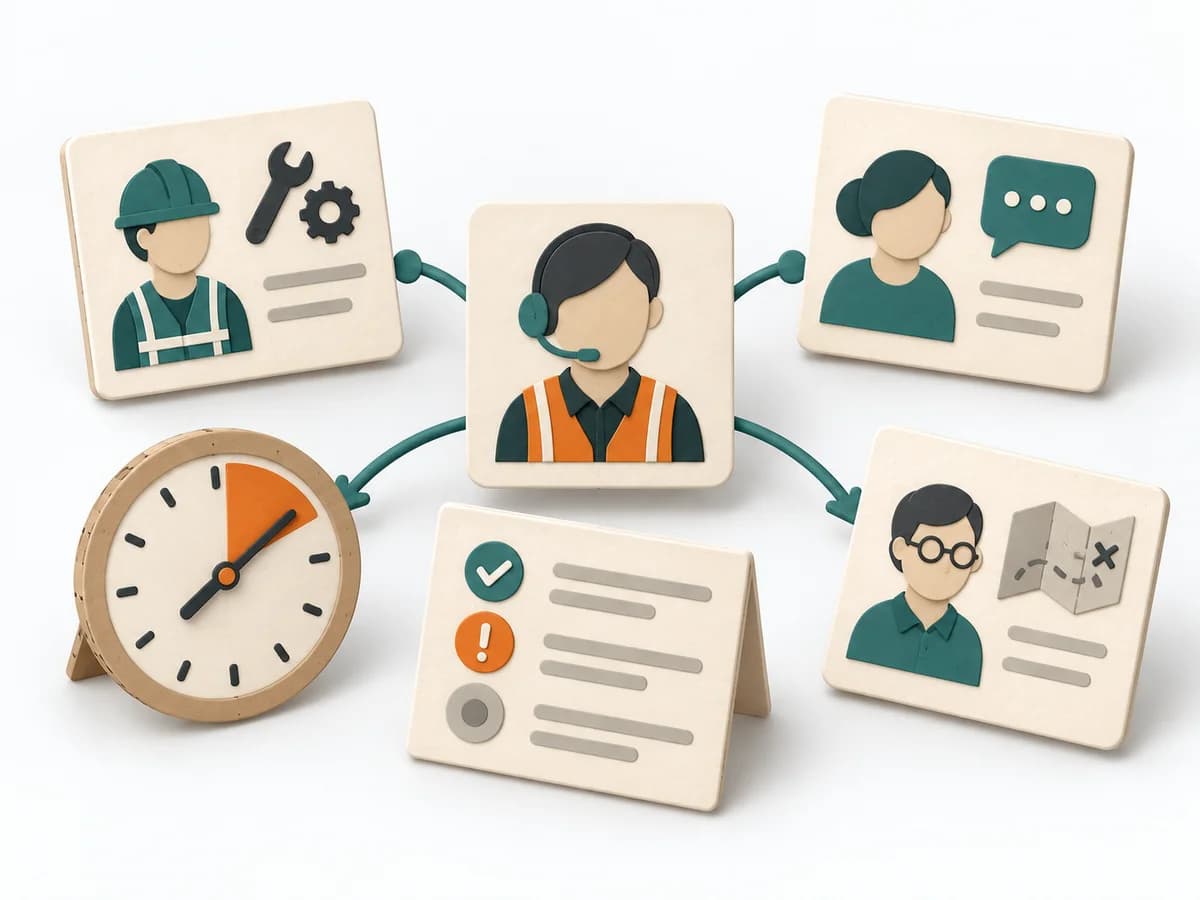 DevOps Incident Command |
|---|---|---|---|---|
Purposedifferent | With high tempo and many parallel topics, the method makes status, deviations, and priorities visible at a glance. It reduces search effort and prevents what matters from getting lost in daily work. | Helps clarify scope, sequence, and delivery flow in concrete terms. It makes work, boundaries, and order steerable. The result is captured as Forecast Percentiles, Throughput Dataset, and Risk Communication. | After an incident with damage or a near miss, the method creates a sober field for learning without assigning blame. It directs attention to the course of events, conditions, and effective countermeasures. | During an acute incident with several people involved, the method creates a clear leadership and communication structure. It reduces chaos when fast coordination and clean situational awareness are both needed at once. |
Complexitydifferent | Low | High | Medium | Medium |
Timedifferent | Ongoing | 30-90 min Setup, danach laufend | 30-90 min | As needed |
Participantsdifferent | 1-20 | 1-8 | 3-12 | 4-15 |
Formatsame | Workshop + async | Workshop + async | Workshop + async | Workshop + async |
Outputdifferent | Visual Board, Status Indicators, Exception Cues | Forecast Percentiles, Throughput Dataset, Risk Communication | Postmortem Doc, Action Items, Timeline | Incident Log, Action Tracker, Stakeholder Updates |
Tagsno overlap | SignalsOperationsVisual management | ForecastingFlowDelivery | Site Reliability EngineeringIncidentLearningReliability | IncidentOperationsReliability |