View methods side by side.
Choose up to four methods. Add them using the search and share the comparison by copying its link.
| Criterion |  Operations Visual Management | 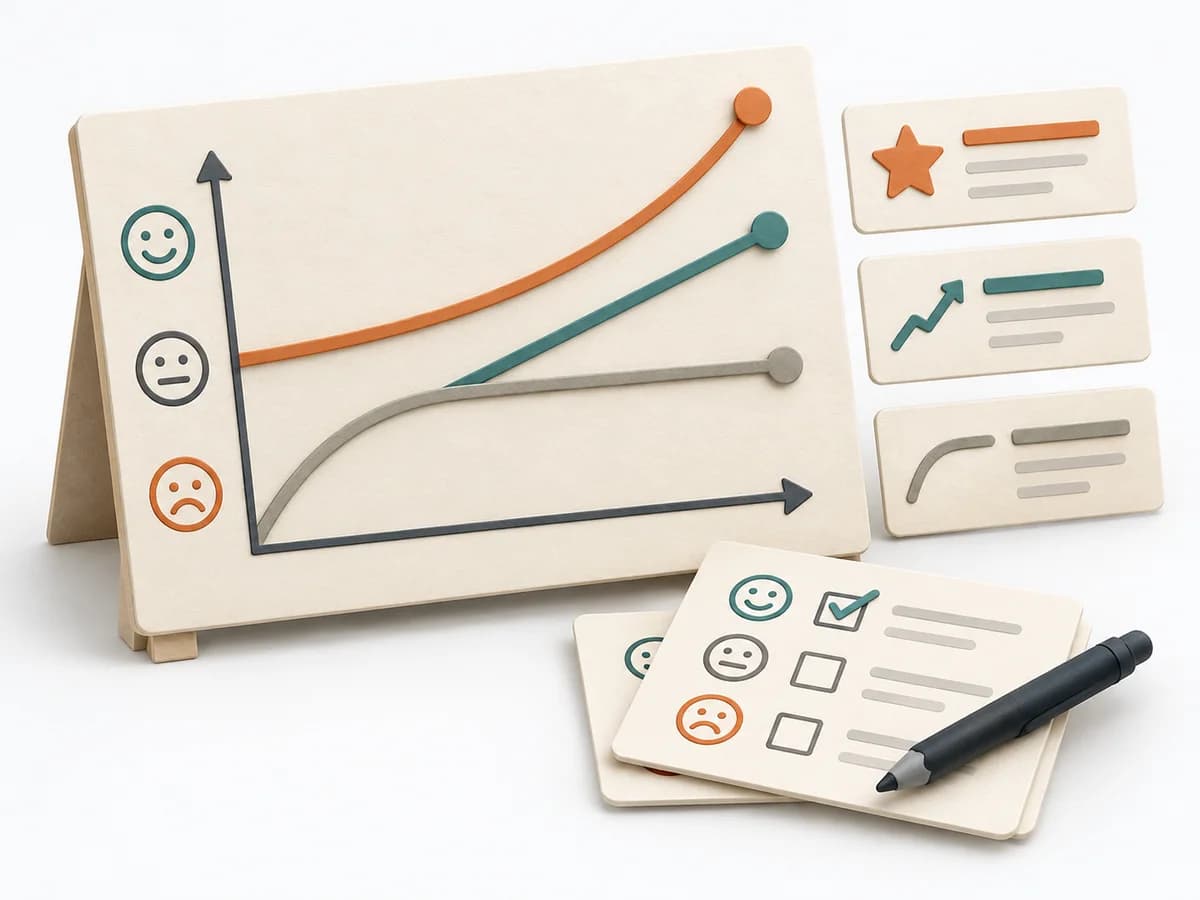 Product Discovery Kano Model |  Product Strategy KPI Tree |  Operations ABC Analysis |
|---|---|---|---|---|
Purposedifferent | With high tempo and many parallel topics, the method makes status, deviations, and priorities visible at a glance. It reduces search effort and prevents what matters from getting lost in daily work. | When features need to be distinguished by their effect on satisfaction, it makes expectations and surprises comparable. It separates basic needs, performance contribution, and delight. | When metrics across the organization drift apart, it arranges drivers and effects under one shared logic. It connects customer value, product logic, and decision priorities. The result is captured as a KPI tree and owner list. | With many similar objects of differing economic significance, the method prioritizes effort by effect. It separates what needs regular steering from what rarely needs attention. |
Complexitydifferent | Low | Medium | Medium | Low |
Timedifferent | Ongoing | 1-2 Tage | 90-180 min initial, dann laufend | 30-60 min |
Participantsdifferent | 1-20 | 10-50 | 3-8 | 1-5 |
Formatdifferent | Workshop + async | Workshop + async | Workshop + async | Async |
Outputdifferent | Visual Board, Status Indicators, Exception Cues | Kano Matrix, Feature Classes, Priority Themes | KPI Tree, Owner List | ABC Classification, Focus Rules, Control List |
Tagsno overlap | SignalsOperationsVisual management | SatisfactionPrioritizationCustomer | MetricsStrategyAlignmentMeasurement | PrioritizationOperationsPortfolio |