View methods side by side.
Choose up to four methods. Add them using the search and share the comparison by copying its link.
| Criterion |  Operations Visual Management | 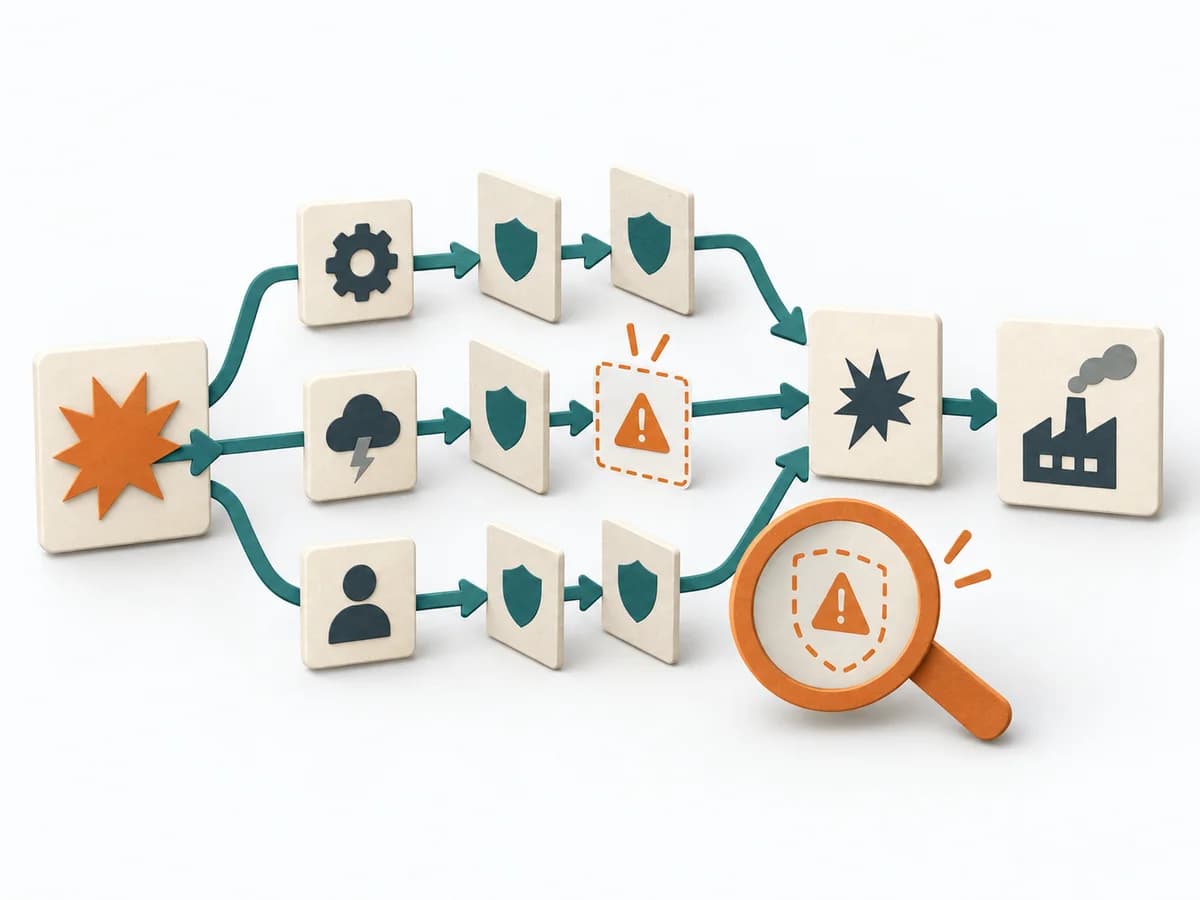 Engineering Failure Scenario Analysis |  Operations A3 Problem Solving |  Operations 5 Whys |
|---|---|---|---|---|
Purposedifferent | With high tempo and many parallel topics, the method makes status, deviations, and priorities visible at a glance. It reduces search effort and prevents what matters from getting lost in daily work. | In critical processes, it is not enough to plan only for the normal case. Failure Scenario Analysis looks at the path into failure and shows which failures, chains, and control gaps cause the most damage. | For a complex deviation with several people involved, the method bundles problem, analysis, and decision onto one page. It creates a shared working space where causes, countermeasures, and follow-up fit together. | For a single, hard-to-explain deviation, the method exposes the causal chain behind the visible symptom. It keeps the cause open until a controllable condition emerges instead of a mere description. |
Complexitydifferent | Low | Medium | Medium | Low |
Timedifferent | Ongoing | 1-3 h | 45-90 min | 15-30 min |
Participantsdifferent | 1-20 | 3-8 | 2-5 | 2-6 |
Formatdifferent | Workshop + async | Workshop | Workshop + async | Workshop |
Outputdifferent | Visual Board, Status Indicators, Exception Cues | Failure Scenarios, Risk Notes, Control Gaps, Test and Response Actions | A3 Report, Action Plan, Root Cause Analysis | Root cause notes, Countermeasures |
Tagsno overlap | SignalsOperationsVisual management | FailureResilienceRisk | LeanProblem solvingCoachingOperations | Root causeIncidentLeanProblem solving |