View methods side by side.
Choose up to four methods. Add them using the search and share the comparison by copying its link.
| Criterion |  Operations Visual Management | 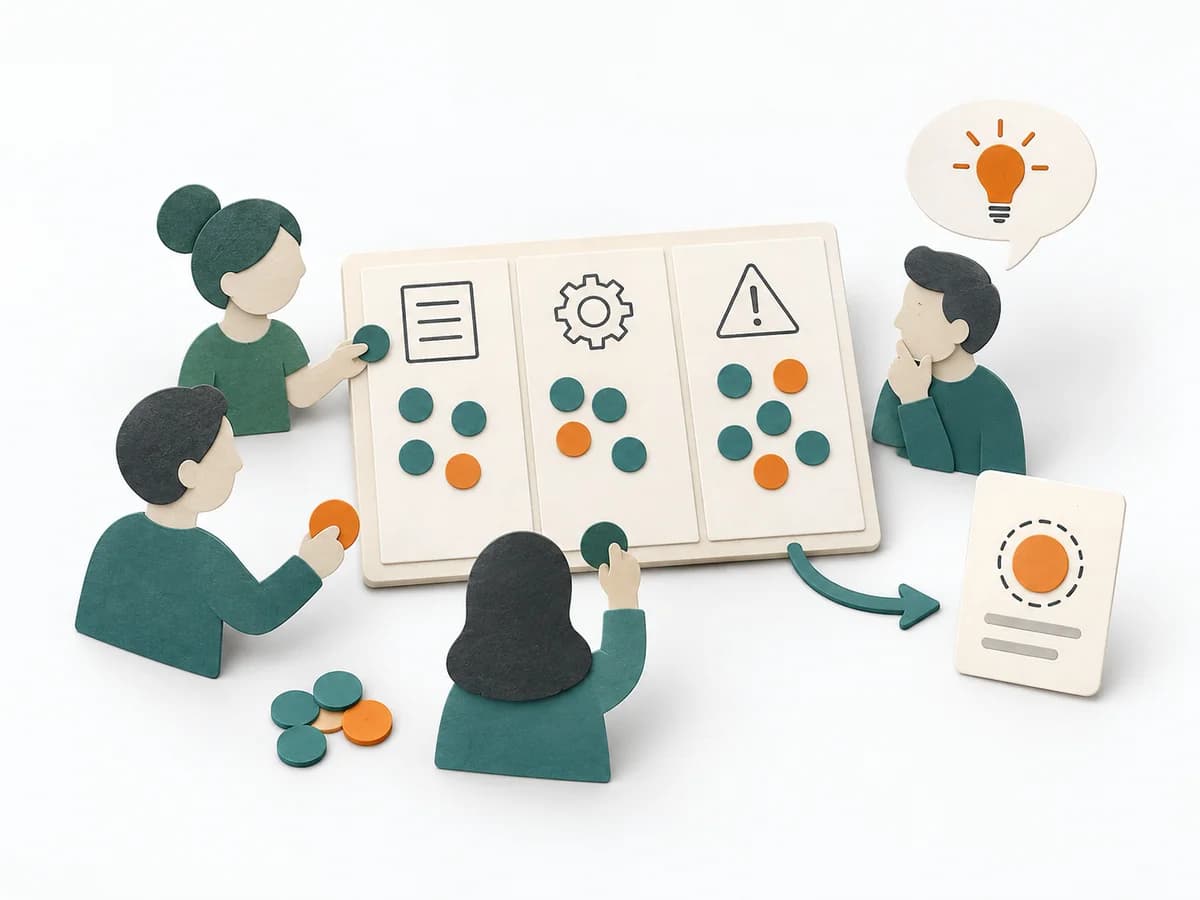 Facilitation Dot Estimation | 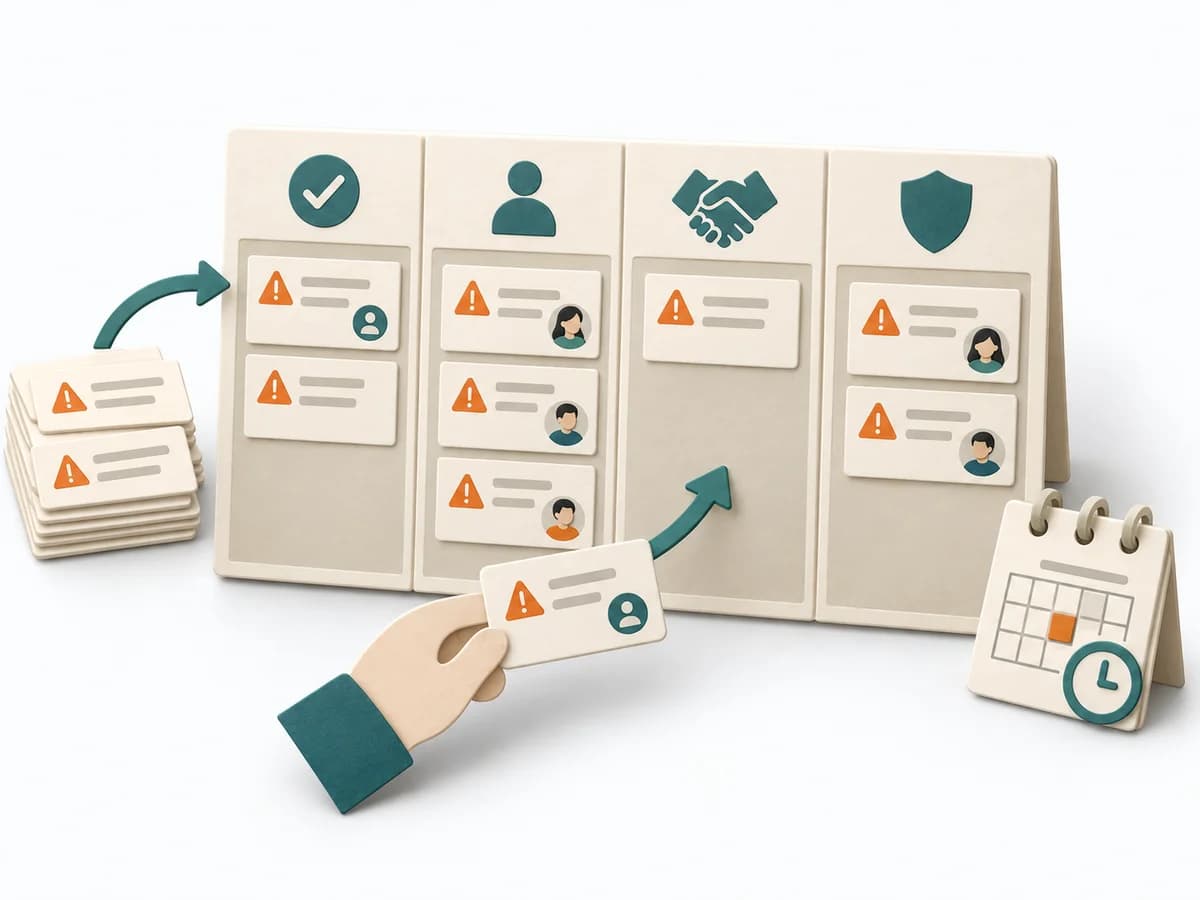 Agile ROAM Board | 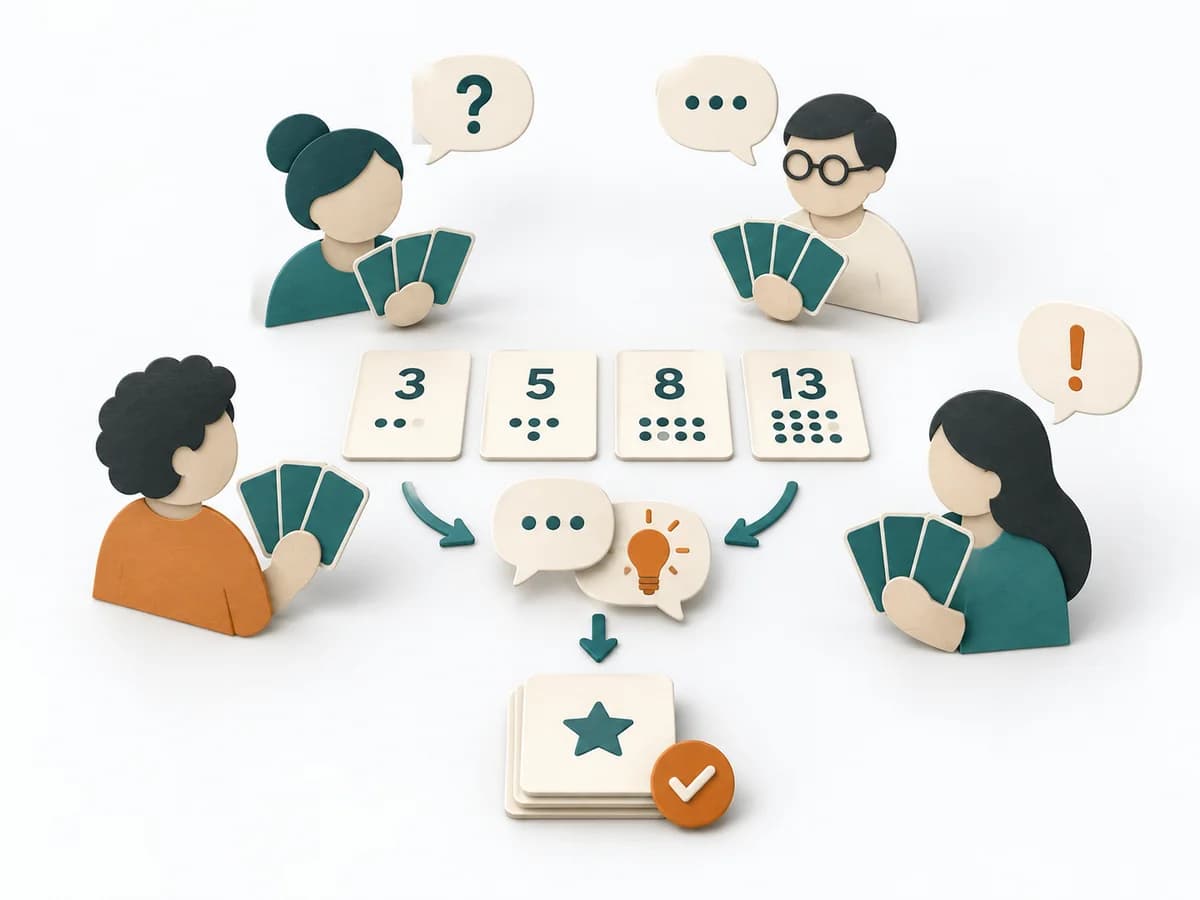 Agile Planning Poker |
|---|---|---|---|---|
Purposedifferent | With high tempo and many parallel topics, the method makes status, deviations, and priorities visible at a glance. It reduces search effort and prevents what matters from getting lost in daily work. | When size or effort can only be estimated roughly, Dot Estimation condenses the group's experience into a quick range. It turns individual contributions into a visible selection. The result is captured as an Effort Heatmap, Risk Signals, and Discussion Targets. | When work needs to move between different states or columns, it makes that movement and its handoffs legible. It sorts work by value, risk, and delivery ability. The result is captured as a ROAM Board and an Owner List. | When estimates within the team diverge too much, it puts differing expectations on a common test bench. It separates rough complexity from unspoken assumptions. |
Complexitysame | Low | Low | Low | Low |
Timedifferent | Ongoing | 5-20 min | 20-40 min initial, dann laufend | 2-5 min je Item |
Participantsdifferent | 1-20 | 3-20 | 3-15 | 3-9 |
Formatdifferent | Workshop + async | Workshop | Workshop + async | Workshop + async |
Outputdifferent | Visual Board, Status Indicators, Exception Cues | Effort Heatmap, Risk Signals, Discussion Targets | ROAM Board, Owner List | Relative Estimates, Assumption Notes, Split Candidates |
Tagsno overlap | SignalsOperationsVisual management | EstimationEffortRisk | RiskAgileTrackingAlignment | EstimationAgileRelative sizingTeam |