View methods side by side.
Choose up to four methods. Add them using the search and share the comparison by copying its link.
| Criterion | 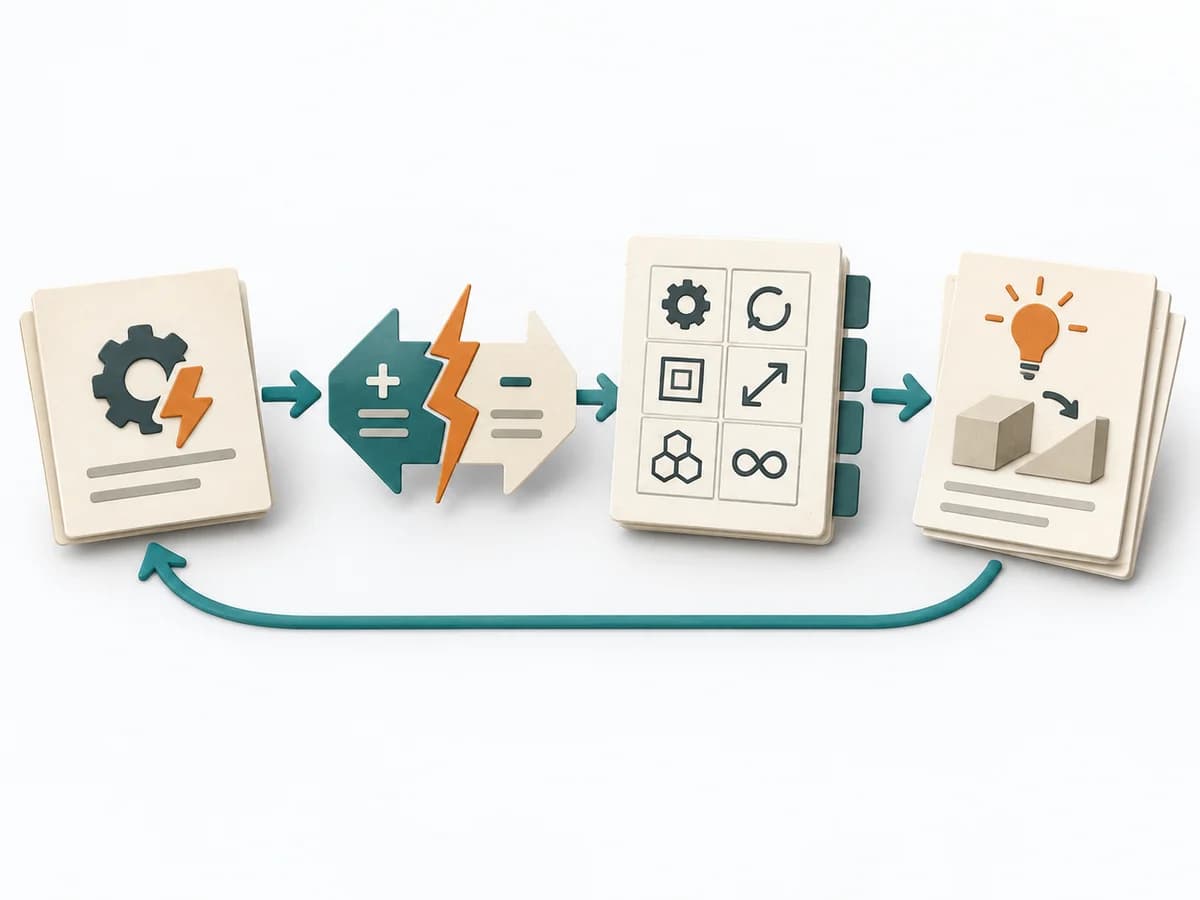 Innovation TRIZ |  Operations A3 Problem Solving |  Operations Failure Mode and Effects Analysis |  Operations Fishbone Diagram |
|---|---|---|---|---|
Purposedifferent | For technical contradictions or trade-offs, the method looks for solutions that resolve opposing requirements at the same time. It translates limits into an explicit picture of conflict that becomes workable. This produces not just compromises but more elegant principles. | For a complex deviation with several people involved, the method bundles problem, analysis, and decision onto one page. It creates a shared working space where causes, countermeasures, and follow-up fit together. | For a process, product, or service with noticeable failure risks, the method assesses possible failure modes in advance. It directs attention to combinations of occurrence, effect, and detectability. | When a problem has several possible contributing factors, the method sorts causes by cause areas. It prevents an initial hunch from blocking the view of other plausible drivers. |
Complexitydifferent | High | Medium | High | Low |
Timedifferent | 1-4 h | 45-90 min | 2-6 h | 30-60 min |
Participantsdifferent | 2-8 | 2-5 | 3-10 | 2-8 |
Formatdifferent | Workshop + async | Workshop + async | Workshop | Workshop |
Outputdifferent | Contradiction Statement, Inventive Principles, Solution Concepts | A3 Report, Action Plan, Root Cause Analysis | FMEA Table, Risk Priority, Mitigation Actions | Fishbone Diagram, Cause Categories, Investigation Backlog |
Tagsno overlap | InnovationProblem solvingContradictionsCreativity | LeanProblem solvingCoachingOperations | RiskQualityOperationsRoot cause | Root causeQualityOperations |