View methods side by side.
Choose up to four methods. Add them using the search and share the comparison by copying its link.
| Criterion | 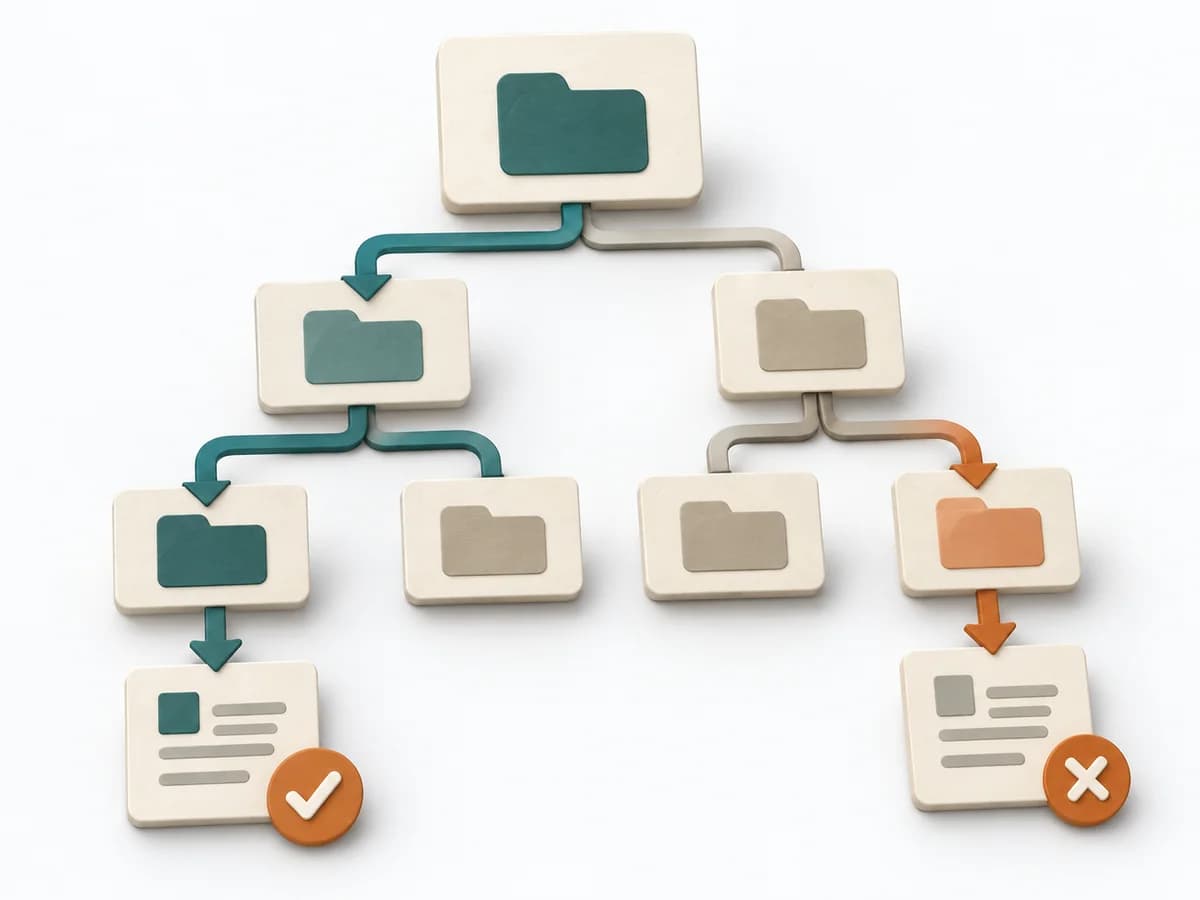 UX Research Tree Testing | 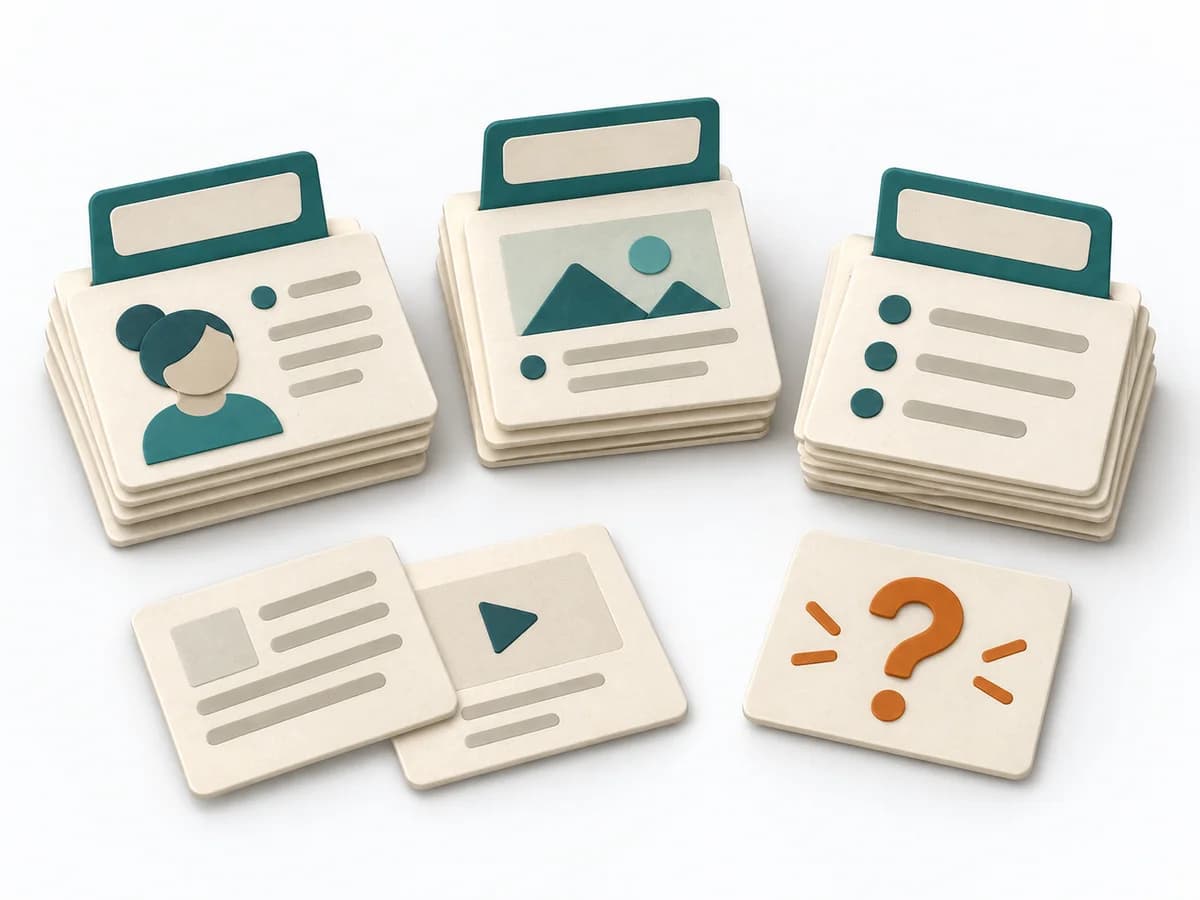 UX Research Card Sorting | 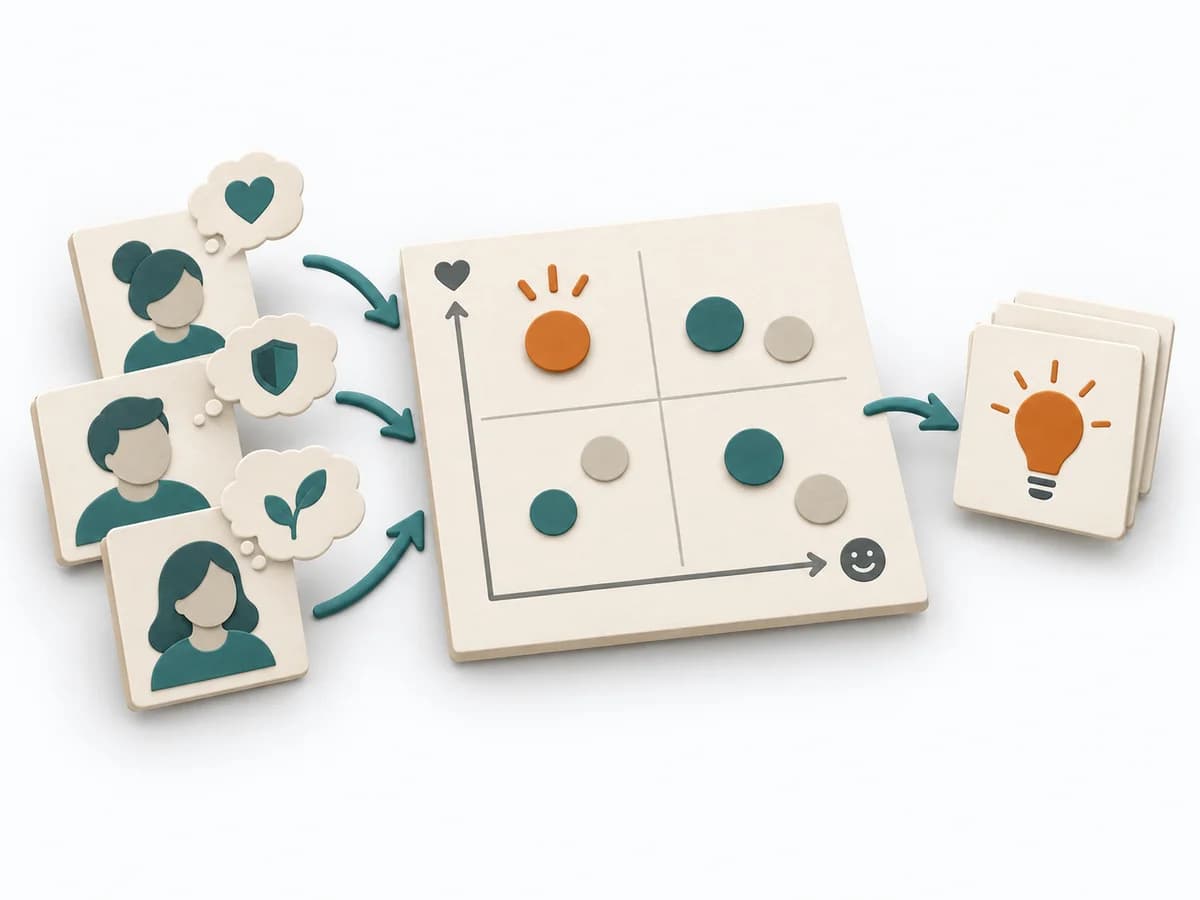 Product Discovery Outcome-Driven Innovation | 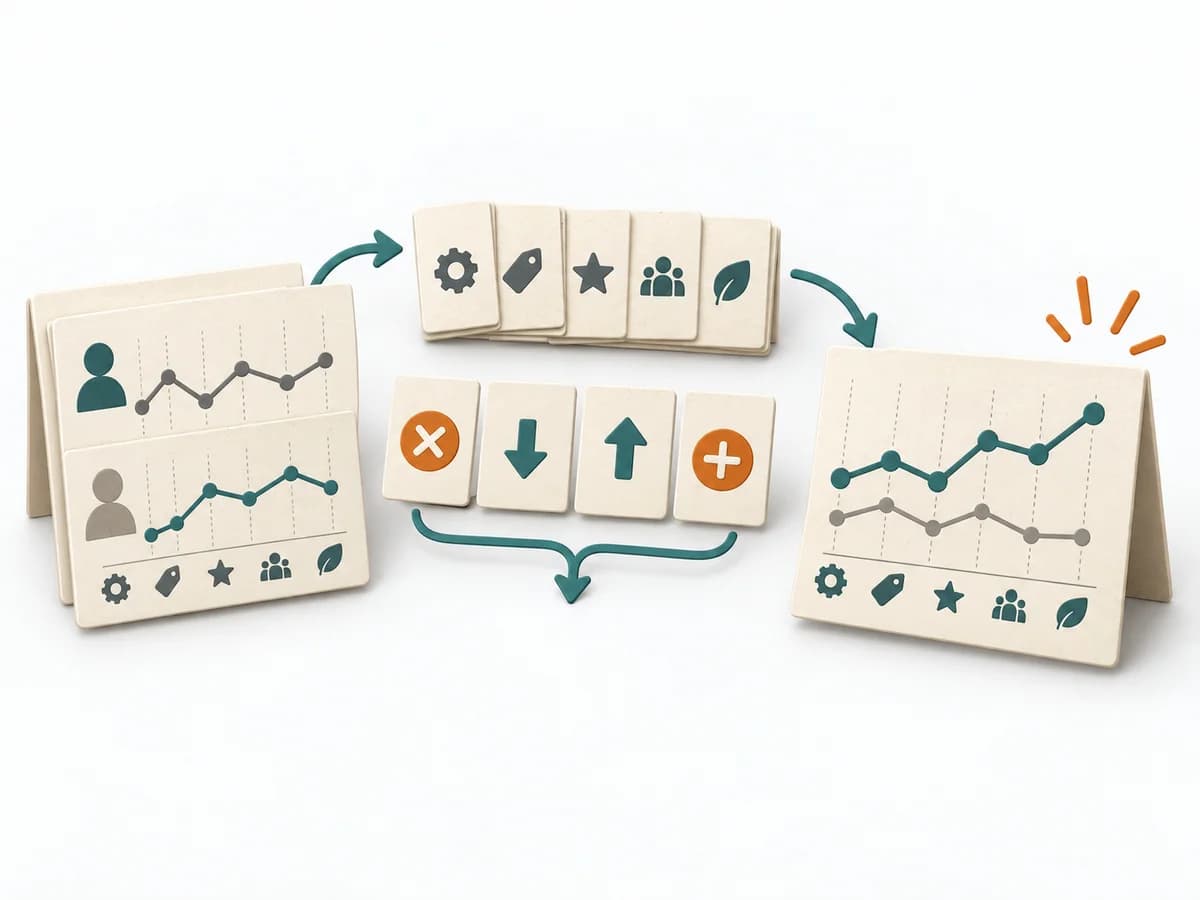 Business Strategy Blue Ocean Strategy Canvas |
|---|---|---|---|---|
Purposedifferent | When a navigation exists but search paths still fail, tree testing checks findability without visual distraction. The method shows whether labels, levels, and paths really lead to the intended destination. | When content only makes sense internally and users can't find the structure again, card sorting exposes their mental order. Terms, groups, and naming are then aligned with the target group's expectations. | Outcome-Driven Innovation clarifies customer problems, solution opportunities, and evidence. It separates jobs, desired outcomes, importance, satisfaction, and opportunity, and captures results as desired outcome statements, an opportunity landscape, and segments by underserved needs. | The Blue Ocean Strategy Canvas shows how an offering is positioned relative to the market. Differentiation thereby becomes tangible in value factors instead of merely being claimed. |
Complexitydifferent | Medium | Low | High | Medium |
Timedifferent | 1-2 Tage | 20-45 min | Mehrere Wochen | 2-4 h |
Participantsdifferent | Based on research question | Based on research question | 2-6 researchers plus sample | 3-10 |
Formatdifferent | Async | Workshop + async | Workshop + async | Workshop |
Outputdifferent | Findability Metrics, Path Analysis, Revised IA | Content groups, Label set, IA hypotheses | Desired outcome statements, Opportunity landscape, Segmentation by underserved needs, Innovation hypotheses | Strategy Canvas, Value Curve, ERRC Actions |
Tagsno overlap | Information architectureNavigationFindability | Information architectureNavigationStructure | OutcomesInnovationResearchQuantitative | StrategyPositioningInnovationValue |