View methods side by side.
Choose up to four methods. Add them using the search and share the comparison by copying its link.
| Criterion | 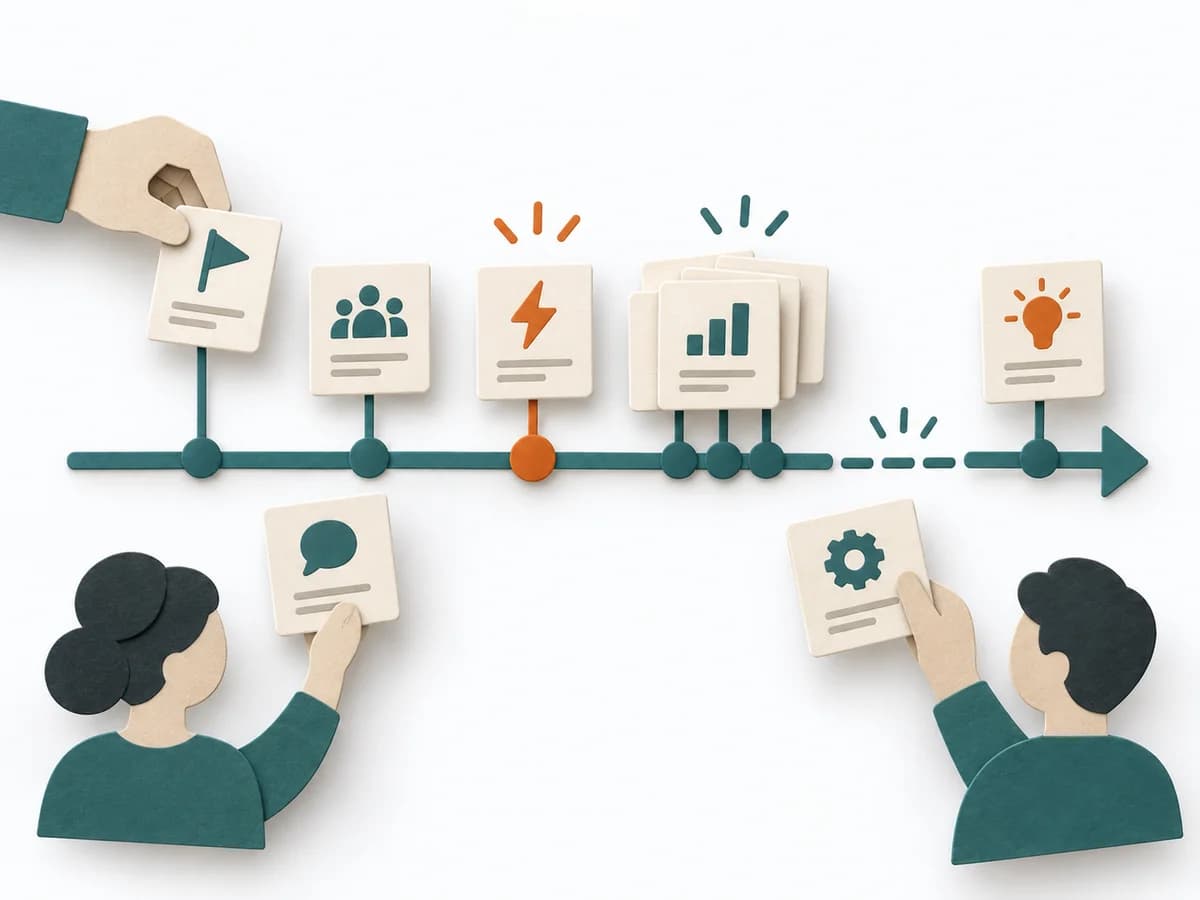 Facilitation Timeline |  Business Strategy GAP Analysis |  Product Strategy KPI Tree | 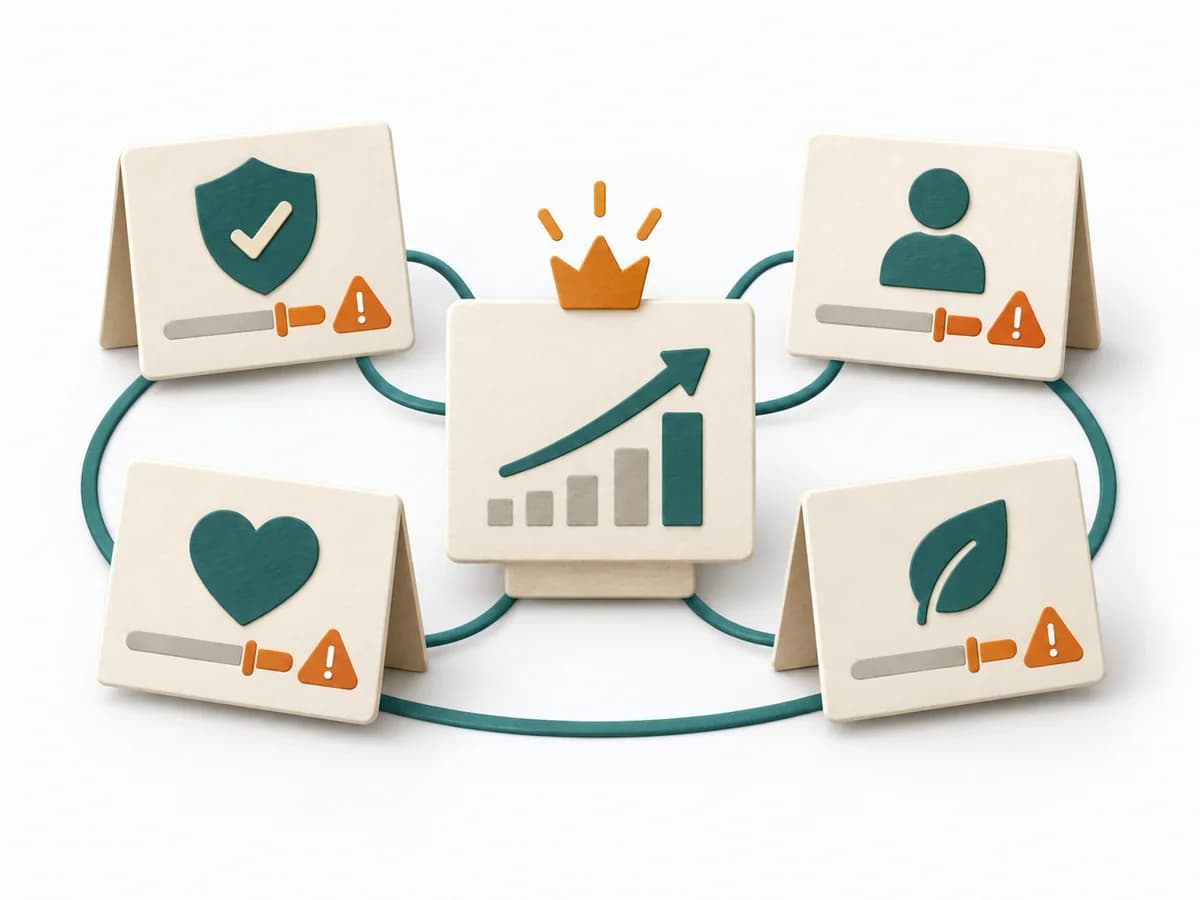 Product Strategy Counter Metrics |
|---|---|---|---|---|
Purposedifferent | When a project, incident, or change process is only remembered in fragments, Timeline brings the sequence back into a readable form. It makes turning points, precursors, and after-effects recognizable over the course of time. | GAP Analysis compares the current state with a target picture and makes the distance manageable. It becomes useful when, ahead of new initiatives, it must become clear which capabilities, processes, or resources are missing. | When metrics across the organization drift apart, it arranges drivers and effects under one shared logic. It connects customer value, product logic, and decision priorities. The result is captured as a KPI tree and owner list. | When a headline metric could mask side effects, it adds guardrail signals against unwanted outcomes. It connects customer value, product logic, and decision priorities. The result is captured as a counter-metric list and guardrail definitions. |
Complexitydifferent | Low | Medium | Medium | Low |
Timedifferent | 30-90 min | 1-3 h | 90-180 min initial, dann laufend | 30-60 min |
Participantsdifferent | 2-12 | 2-8 | 3-8 | 2-6 |
Formatsame | Workshop + async | Workshop + async | Workshop + async | Workshop + async |
Outputdifferent | Timeline, Milestones, Insight Notes | Gap Matrix, Action Plan, Risk Notes | KPI Tree, Owner List | Counter Metric List, Guardrail Definitions |
Tagsno overlap | TimelineFacilitationSequence | StrategyAnalysisPlanning | MetricsStrategyAlignmentMeasurement | MetricsMeasurementStrategyExperiments |