View methods side by side.
Choose up to four methods. Add them using the search and share the comparison by copying its link.
Selected:Team Topologies Interaction Modes8D Problem SolvingFishbone DiagramFailure Mode and Effects Analysis
| Criterion | 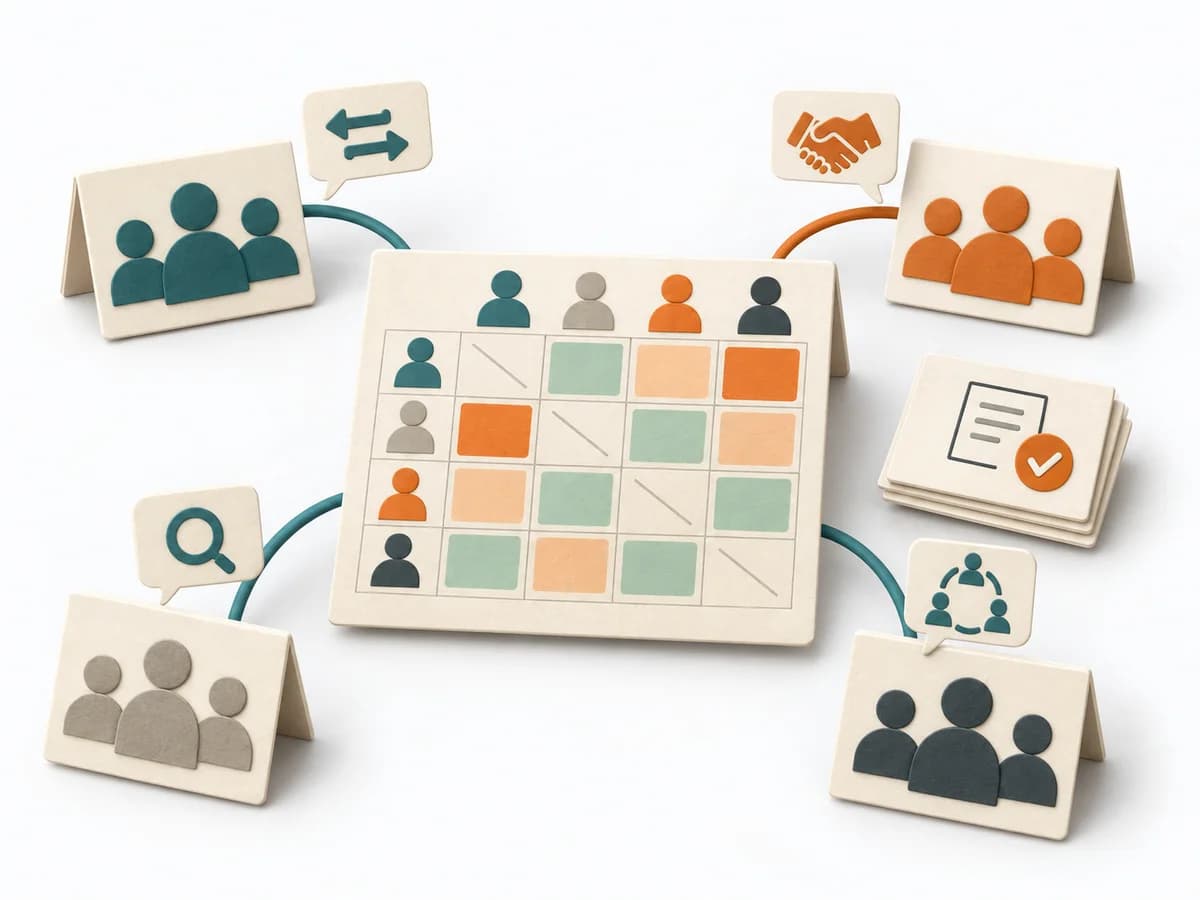 Team Design Team Topologies Interaction Modes |  Operations 8D Problem Solving |  Operations Fishbone Diagram |  Operations Failure Mode and Effects Analysis |
|---|---|---|---|---|
Purposedifferent | When several teams collaborate repeatedly, it describes the right interaction mode for each interface between them. It clarifies responsibility, interaction, and load between teams. The result is captured as an interaction heat map and pairwise agreements. | For an acute quality or delivery problem, the method structures immediate protection and root cause work together. It keeps the situation stable while the actual cause is investigated cleanly. | When a problem has several possible contributing factors, the method sorts causes by cause areas. It prevents an initial hunch from blocking the view of other plausible drivers. | For a process, product, or service with noticeable failure risks, the method assesses possible failure modes in advance. It directs attention to combinations of occurrence, effect, and detectability. |
Complexitydifferent | Medium | High | Low | High |
Timedifferent | Half day | 1-6 Wochen | 30-60 min | 2-6 h |
Participantsdifferent | Team-Leads plus Architecture | 4-10 | 2-8 | 3-10 |
Formatdifferent | Workshop | Workshop + async | Workshop | Workshop |
Outputdifferent | Interaction Heat Map, Agreements per Pair | 8D Report, Containment Plan, Root Cause Evidence, Corrective Action Plan | Fishbone Diagram, Cause Categories, Investigation Backlog | FMEA Table, Risk Priority, Mitigation Actions |
Tagsno overlap | TeamAlignmentCollaborationOrganization | QualityProblem solvingRoot cause | Root causeQualityOperations | RiskQualityOperationsRoot cause |