View methods side by side.
Choose up to four methods. Add them using the search and share the comparison by copying its link.
| Criterion | 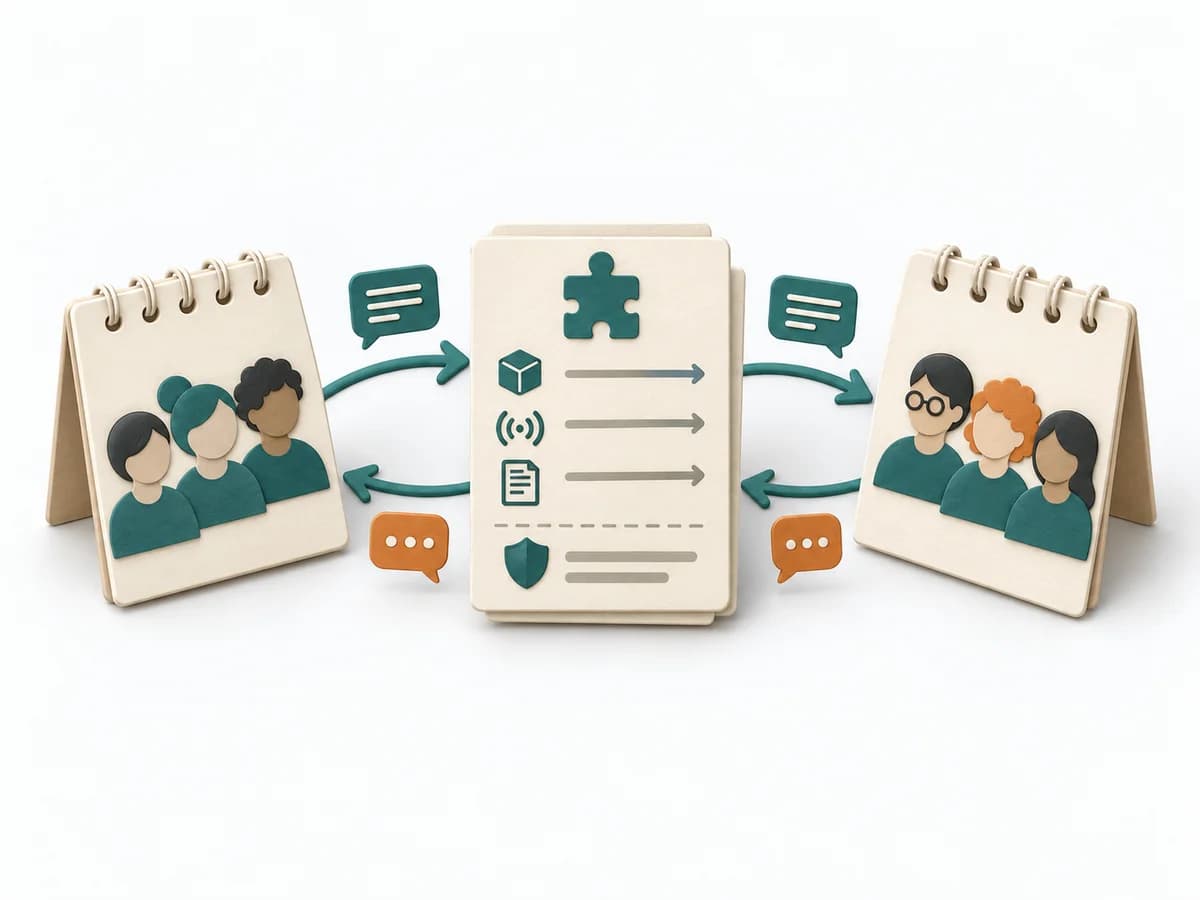 Team Design Team API |  Product Strategy Counter Metrics | 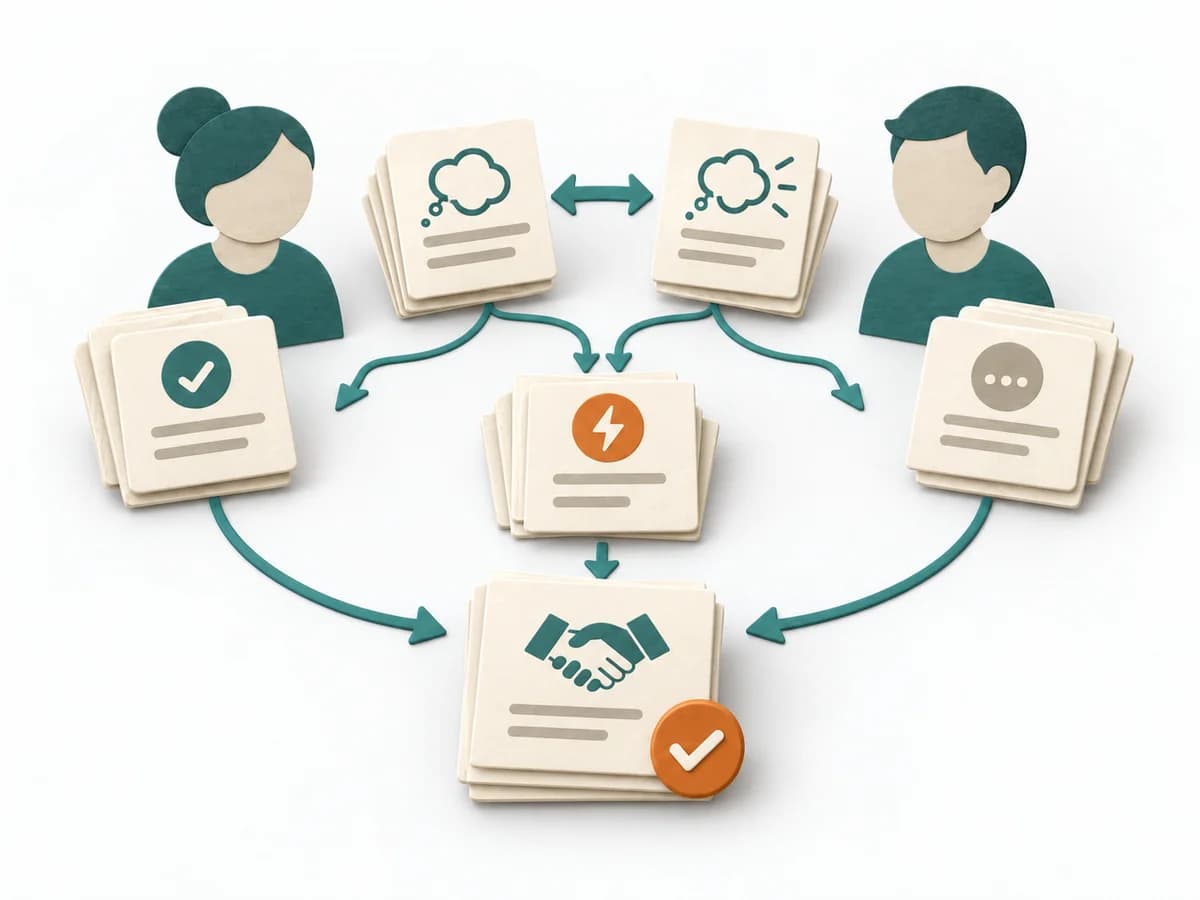 Facilitation Expectation Mapping |  Product Strategy KPI Tree |
|---|---|---|---|---|
Purposedifferent | When expectations between teams stay fuzzy, it describes how a team can be reached, used, and held accountable. It clarifies responsibility, interaction, and load between teams. The result is captured as a Team API document. | When a headline metric could mask side effects, it adds guardrail signals against unwanted outcomes. It connects customer value, product logic, and decision priorities. The result is captured as a counter-metric list and guardrail definitions. | When roles, interfaces, or projects fail because of differing expectations, Expectation Mapping surfaces these differences. It shows what each side takes for granted and where the pictures diverge. | When metrics across the organization drift apart, it arranges drivers and effects under one shared logic. It connects customer value, product logic, and decision priorities. The result is captured as a KPI tree and owner list. |
Complexitydifferent | Low | Low | Low | Medium |
Timedifferent | Half day initial, dann laufend | 30-60 min | 45-90 min | 90-180 min initial, dann laufend |
Participantsdifferent | Ein Team plus Stakeholder | 2-6 | 3-12 | 3-8 |
Formatdifferent | Workshop + async | Workshop + async | Workshop | Workshop + async |
Outputdifferent | Team API Document | Counter Metric List, Guardrail Definitions | Expectation Map, Alignment Notes, Agreements | KPI Tree, Owner List |
Tagsno overlap | TeamAlignmentCommunicationService | MetricsMeasurementStrategyExperiments | AlignmentStakeholdersTeam | MetricsStrategyAlignmentMeasurement |