View methods side by side.
Choose up to four methods. Add them using the search and share the comparison by copying its link.
| Criterion |  Delivery Shape Up | 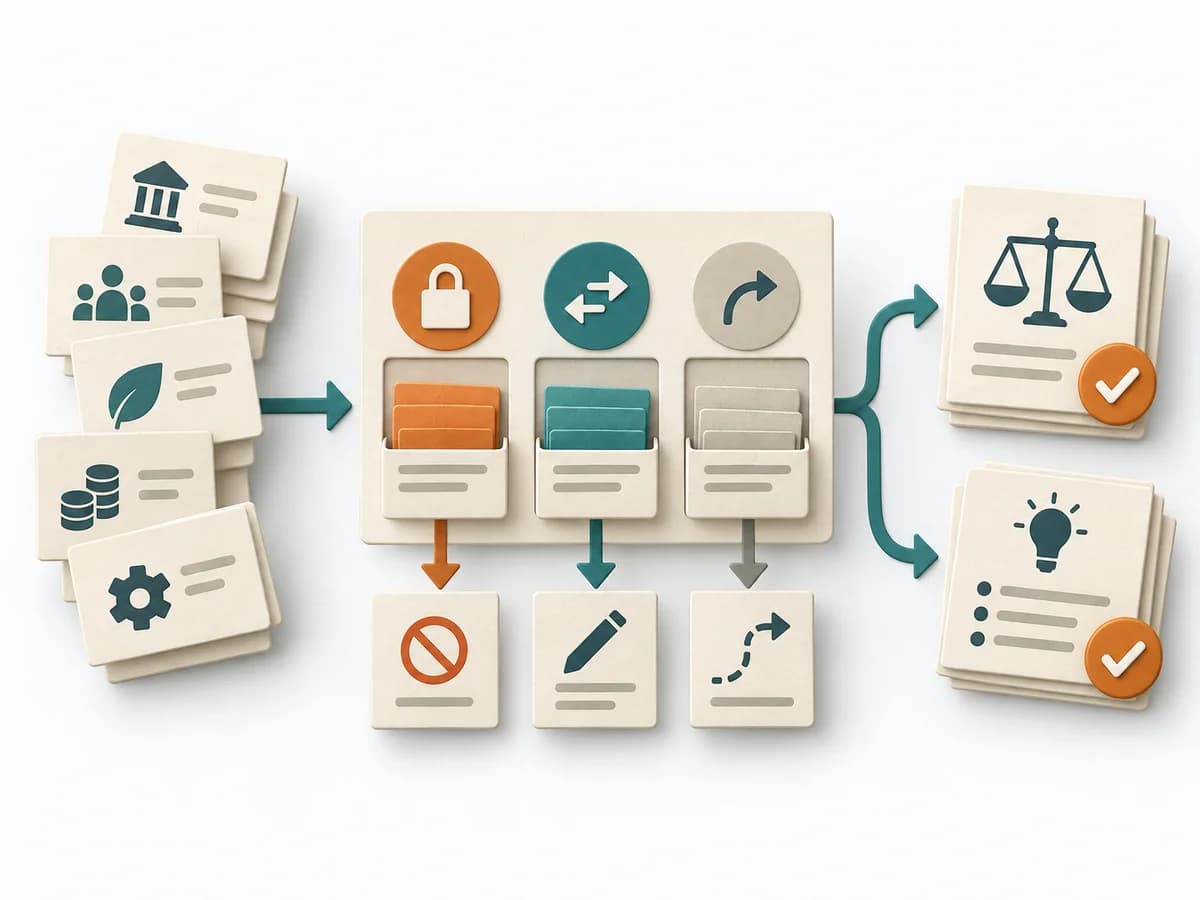 Decision Making Constraint Analysis |  Systems Thinking Current Reality Tree |  Systems Thinking Causal Loop Diagram |
|---|---|---|---|---|
Purposedifferent | Shape Up helps clarify scope, sequence, and delivery flow. It makes work boundaries and decisions explicit and captures results as pitches, bet-table decisions, and hill charts. | When an initiative stalls, the limit often lies not in the idea but in hard or soft boundary conditions. Constraint Analysis separates these limits and shows which of them can actually be shaped. | A Current Reality Tree condenses many symptoms into a few causal chains. The method makes visible which core problems drive several negative effects at once. | A Causal Loop Diagram makes feedback, reinforcement, and balance in a system legible. It uncovers side effects and self-reinforcement that stay hidden in linear explanations. |
Complexitydifferent | Medium | Low | High | Medium |
Timedifferent | 6 Wochen Cycle + 2 Wochen Cool-Down | 30-90 min | 2-6 h | 1-3 h |
Participantsdifferent | 2-4 pro Pitch | 2-8 | 3-8 | 2-8 |
Formatdifferent | Workshop + async | Workshop + async | Workshop | Workshop |
Outputdifferent | Pitches, Bet-table decisions, Hill charts, Cooldown outcomes | Constraint List, Hard/Soft Classification, Option Impact Notes, Decision Boundaries | Current Reality Tree, Core Problems, Intervention Ideas | Causal Loop Diagram, Feedback Notes, Leverage Points |
Tagsno overlap | PlanningDeliveryAutonomy | ConstraintsDecisionPlanningOptions | Systems thinkingRoot causeConstraintsCausality | FeedbackSystems thinkingCausalityDynamics |