View methods side by side.
Choose up to four methods. Add them using the search and share the comparison by copying its link.
| Criterion | 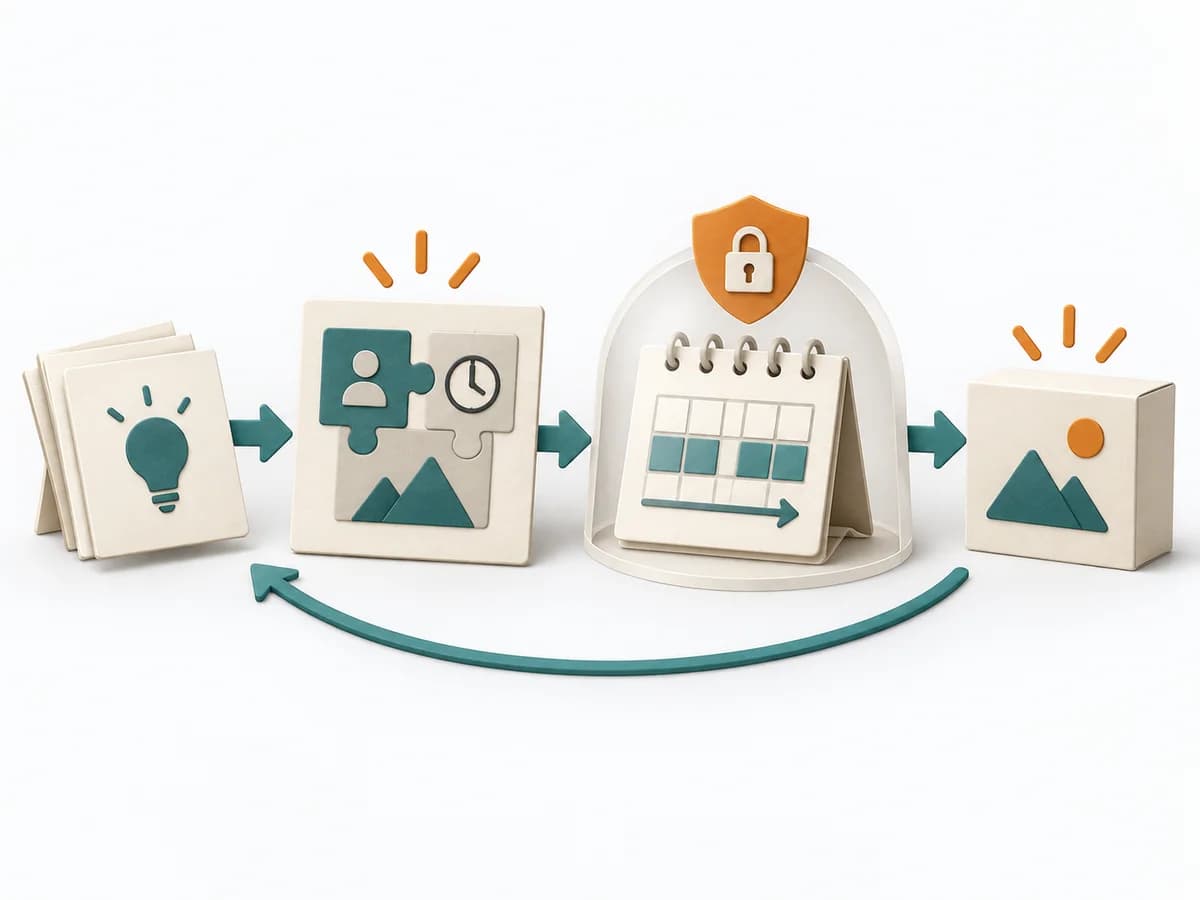 Delivery Shape Up |  Delivery Communication Plan |  Systems Thinking Causal Loop Diagram |  Systems Thinking Behavior Over Time Graph |
|---|---|---|---|---|
Purposedifferent | Shape Up helps clarify scope, sequence, and delivery flow. It makes work boundaries and decisions explicit and captures results as pitches, bet-table decisions, and hill charts. | When many people need to be informed in parallel and messages would otherwise arrive unevenly or too late, a Communication Plan orders communication reliably. Channels, audiences, and cadences interlock so important information doesn't get lost. | A Causal Loop Diagram makes feedback, reinforcement, and balance in a system legible. It uncovers side effects and self-reinforcement that stay hidden in linear explanations. | A Behavior Over Time Graph shows how a metric or observation develops over time. The method makes trends, breaks, and recurring patterns visible that get lost in snapshots. |
Complexitydifferent | Medium | Low | Medium | Low |
Timedifferent | 6 Wochen Cycle + 2 Wochen Cool-Down | 45-90 min | 1-3 h | 20-45 min |
Participantsdifferent | 2-4 pro Pitch | 2-6 | 2-8 | 1-10 |
Formatdifferent | Workshop + async | Workshop + async | Workshop | Workshop + async |
Outputdifferent | Pitches, Bet-table decisions, Hill charts, Cooldown outcomes | Communication Plan, Channel Matrix, Message Cadence | Causal Loop Diagram, Feedback Notes, Leverage Points | Behavior Over Time Graph, Trend Hypotheses, Key Events |
Tagsno overlap | PlanningDeliveryAutonomy | CommunicationStakeholdersDeliveryPlanning | FeedbackSystems thinkingCausalityDynamics | Systems thinkingPatternsDynamics |