View methods side by side.
Choose up to four methods. Add them using the search and share the comparison by copying its link.
| Criterion | 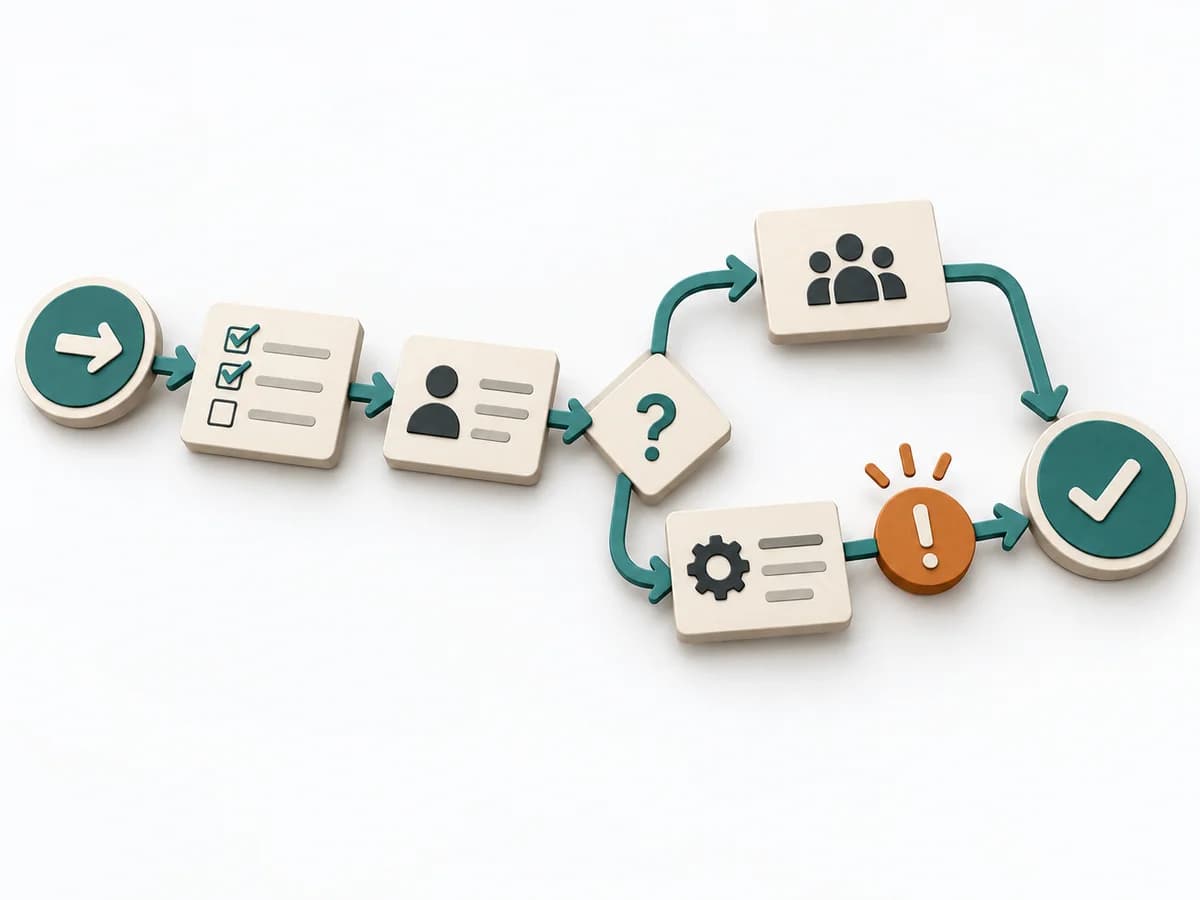 Operations Process Mapping |  DevOps Game Day |  Operations 8D Problem Solving |  Operations Fishbone Diagram |
|---|---|---|---|---|
Purposedifferent | With a confusing workflow that has many handoffs, the method makes the actual process visible. It shows where work is passed on, delayed, or duplicated, so improvement targets the right spots. | In preparing for rare incidents, the method tests response capability under controlled conditions. It shows where assumptions about stability, roles, and recovery are too optimistic. | For an acute quality or delivery problem, the method structures immediate protection and root cause work together. It keeps the situation stable while the actual cause is investigated cleanly. | When a problem has several possible contributing factors, the method sorts causes by cause areas. It prevents an initial hunch from blocking the view of other plausible drivers. |
Complexitydifferent | Medium | High | High | Low |
Timedifferent | 1-3 h | Halber Tag | 1-6 Wochen | 30-60 min |
Participantsdifferent | 3-10 | 5-20 | 4-10 | 2-8 |
Formatdifferent | Workshop | Workshop | Workshop + async | Workshop |
Outputdifferent | Process Map, Handoff List, Improvement Backlog | Simulation Notes, Gaps List, Updated Runbooks | 8D Report, Containment Plan, Root Cause Evidence, Corrective Action Plan | Fishbone Diagram, Cause Categories, Investigation Backlog |
Tagsno overlap | ProcessOperationsImprovement | ResilienceOperationsIncident | QualityProblem solvingRoot cause | Root causeQualityOperations |