View methods side by side.
Choose up to four methods. Add them using the search and share the comparison by copying its link.
| Criterion | 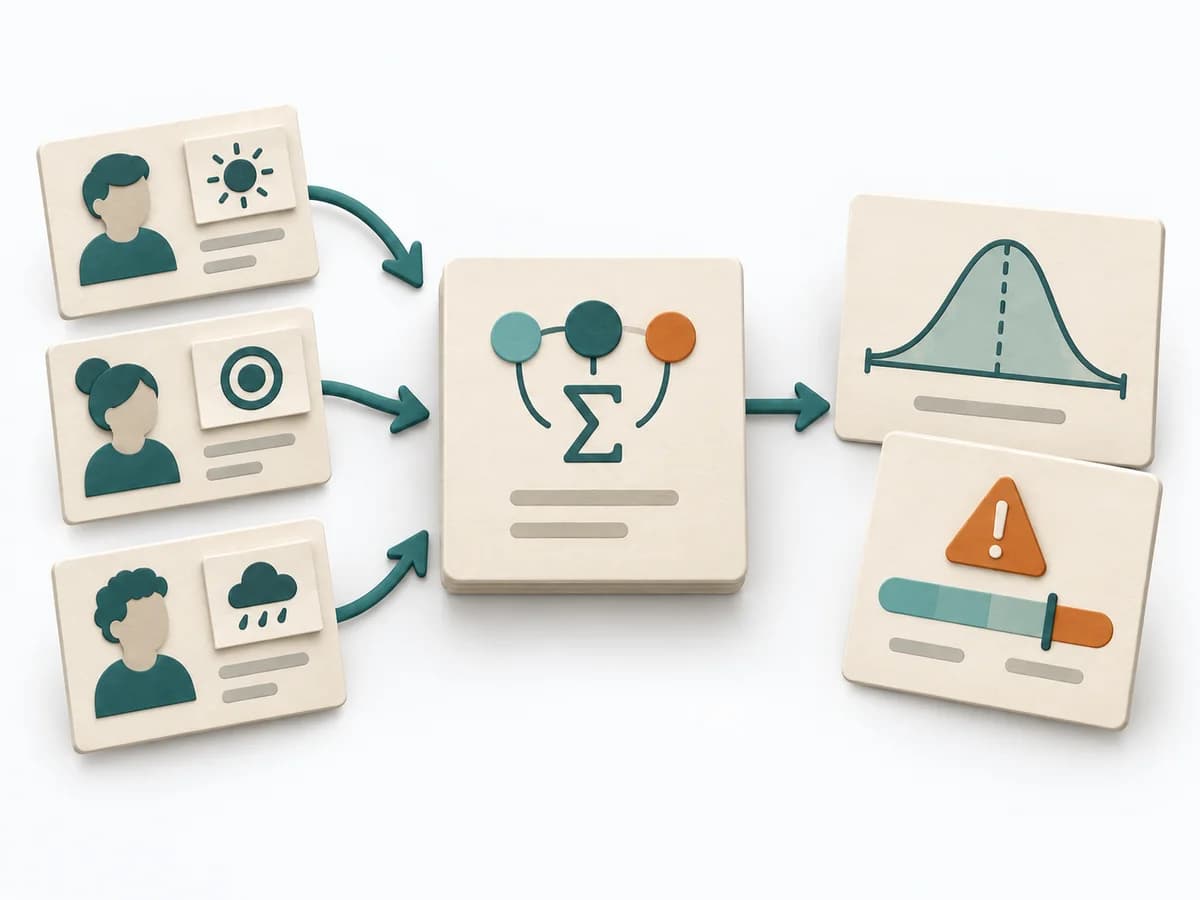 Decision Making PERT Estimation |  Delivery Value Stream Mapping |  Delivery Monte Carlo Forecasting |  Facilitation Dot Estimation |
|---|---|---|---|---|
Purposedifferent | On complex initiatives, a plain average tends to understate just how uncertain the outcome really is. It separates options, evaluation criteria, and open risks. The result is captured as a PERT Estimate, Expected Value, and Risk Notes. | When delivery work dissolves into wait times, handoffs, and hidden effort, Value Stream Mapping makes the actual flow visible. The method exposes bottlenecks, idle time, and feedback loops so lead time and improvement levers become tangible. | Helps clarify scope, sequence, and delivery flow in concrete terms. It makes work, boundaries, and order steerable. The result is captured as Forecast Percentiles, Throughput Dataset, and Risk Communication. | When size or effort can only be estimated roughly, Dot Estimation condenses the group's experience into a quick range. It turns individual contributions into a visible selection. The result is captured as an Effort Heatmap, Risk Signals, and Discussion Targets. |
Complexitydifferent | Medium | Medium | High | Low |
Timedifferent | 15-45 min | 1-3 h | 30-90 min Setup, danach laufend | 5-20 min |
Participantsdifferent | 1-8 | 4-10 | 1-8 | 3-20 |
Formatdifferent | Workshop + async | Workshop | Workshop + async | Workshop |
Outputdifferent | PERT Estimate, Expected Value, Risk Notes | Current-state map, Future-state map, Bottleneck list | Forecast Percentiles, Throughput Dataset, Risk Communication | Effort Heatmap, Risk Signals, Discussion Targets |
Tagsno overlap | EstimationUncertaintyRisk | LeanFlowWasteDelivery | ForecastingFlowDelivery | EstimationEffortRisk |