View methods side by side.
Choose up to four methods. Add them using the search and share the comparison by copying its link.
| Criterion | 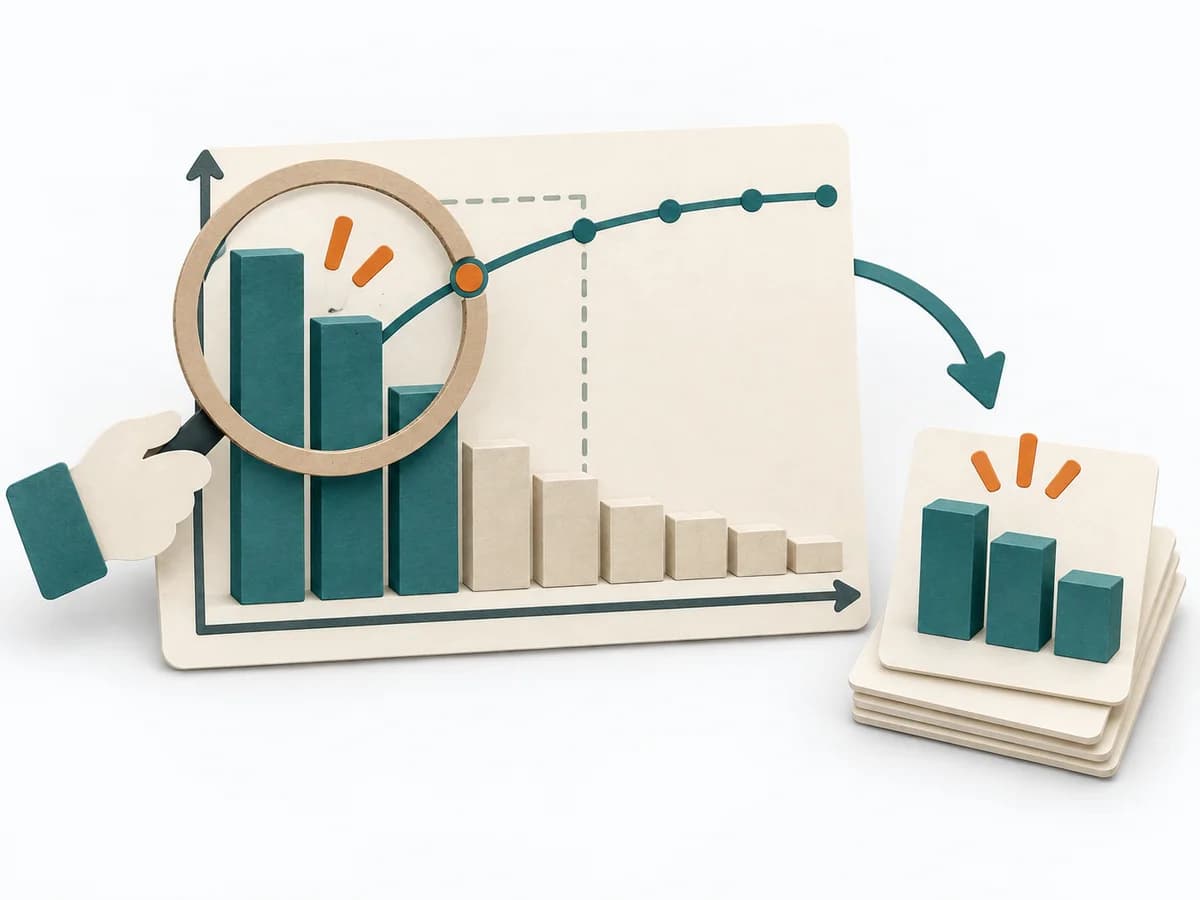 Decision Making Pareto Analysis |  Operations Fishbone Diagram | 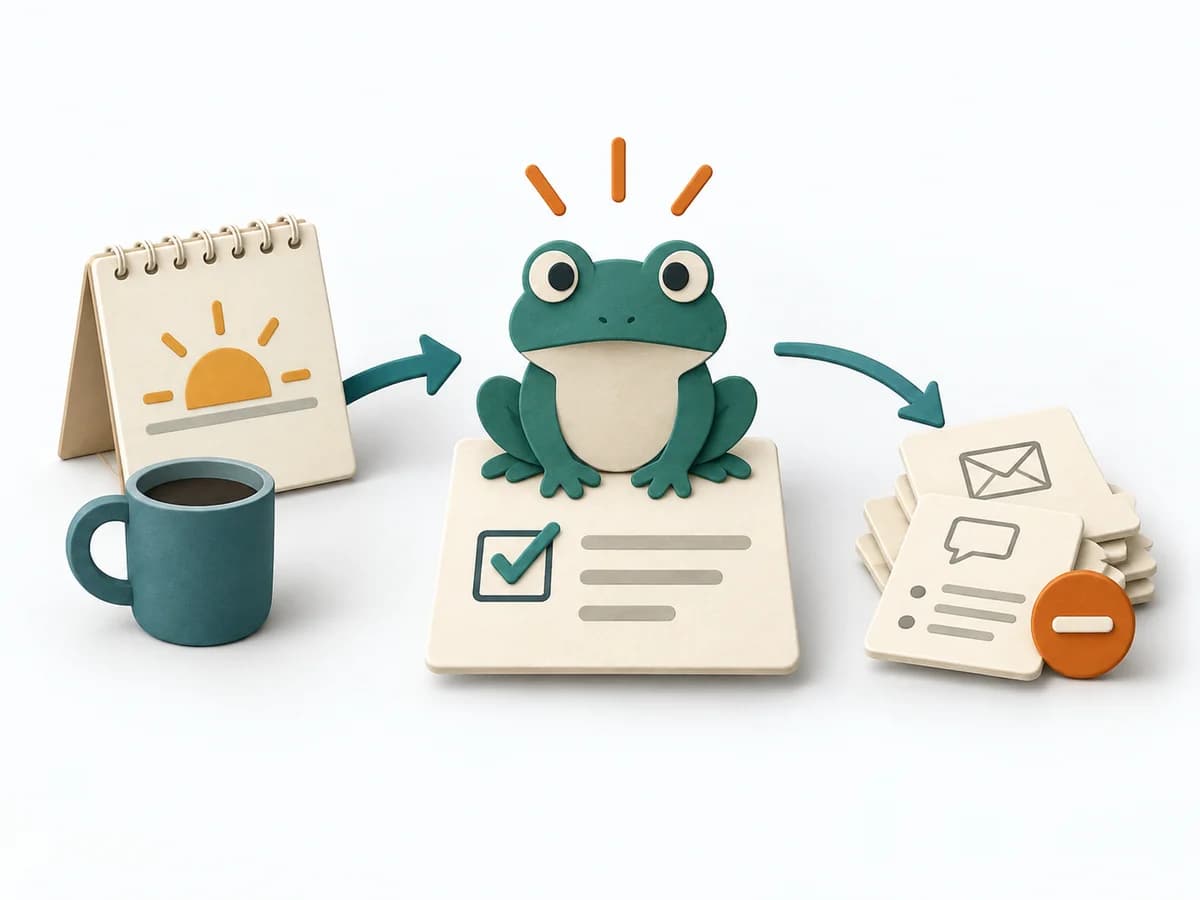 Operations Eat the Frog | 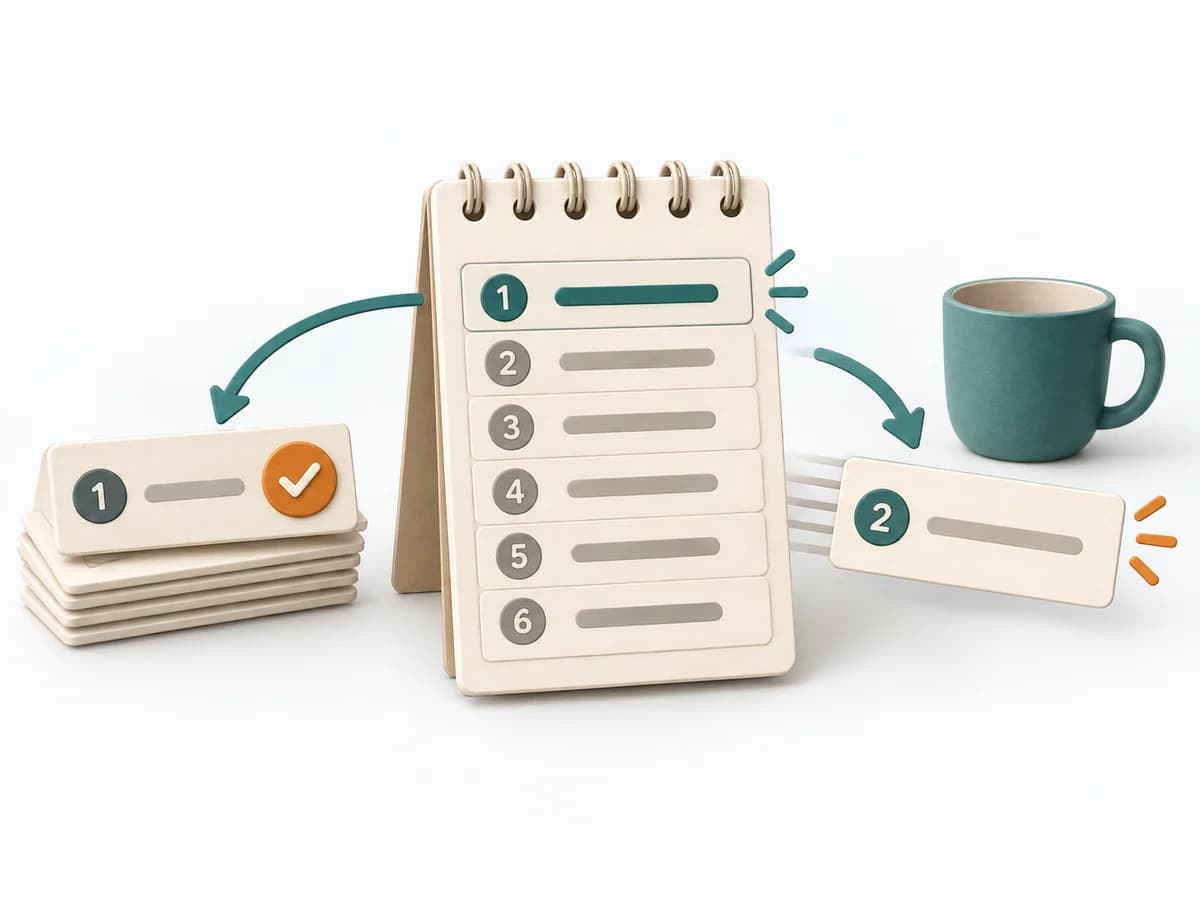 Operations Ivy Lee Method |
|---|---|---|---|---|
Purposedifferent | In many problem situations, effect is distributed unequally across many causes. A Pareto Analysis separates the few drivers with high leverage from the long remainder and focuses attention on what measurably moves the needle. | When a problem has several possible contributing factors, the method sorts causes by cause areas. It prevents an initial hunch from blocking the view of other plausible drivers. | The method protects energy and attention for the task that creates the largest progress and is often postponed. | With a restless workday full of too many open items, the method creates radical simplicity. It directs attention to a short sequence instead of a broad, still-open field. |
Complexitysame | Low | Low | Low | Low |
Timedifferent | 30-60 min | 30-60 min | 15-90 min daily | 5-10 min daily |
Participantsdifferent | 1-6 | 2-8 | 1 | 1 |
Formatdifferent | Workshop + async | Workshop | Async | Async |
Outputdifferent | Pareto Chart, Top Causes, Focus List | Fishbone Diagram, Cause Categories, Investigation Backlog | Priority Task, Completion Note, Daily Focus | Daily Priority List, Completion Notes |
Tagsno overlap | PrioritizationQualityFocusRoot cause | Root causeQualityOperations | PrioritizationProductivityFocusExecution | PrioritizationProductivityExecution |