View methods side by side.
Choose up to four methods. Add them using the search and share the comparison by copying its link.
| Criterion | 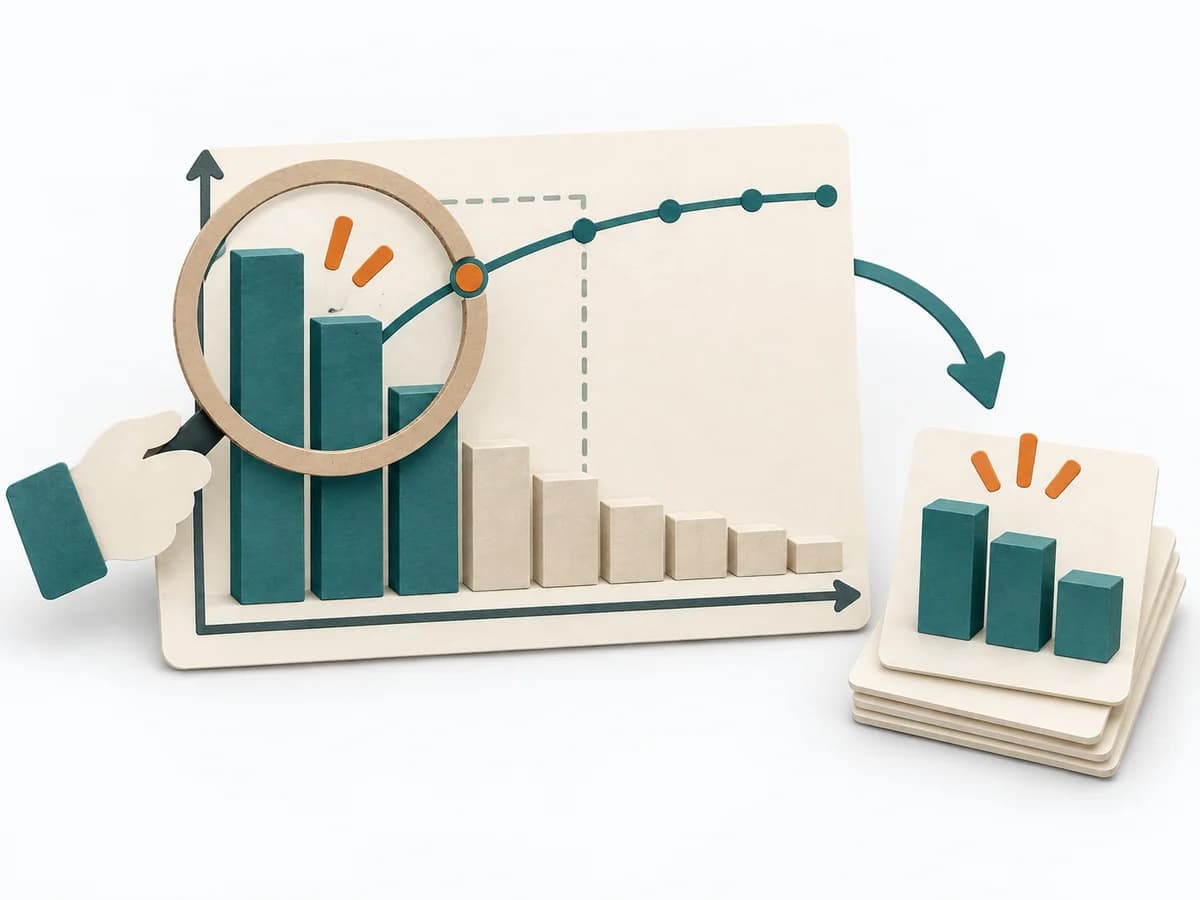 Decision Making Pareto Analysis |  Operations ABC Analysis |  UX Research Affinity Diagramming |  Operations Eat the Frog |
|---|---|---|---|---|
Purposedifferent | In many problem situations, effect is distributed unequally across many causes. A Pareto Analysis separates the few drivers with high leverage from the long remainder and focuses attention on what measurably moves the needle. | With many similar objects of differing economic significance, the method prioritizes effort by effect. It separates what needs regular steering from what rarely needs attention. | When research notes, feedback, or observations sit unconnected side by side, affinity diagramming sorts the raw material into solid themes. Many individual points turn into patterns that make decisions and opportunities clearer. | The method protects energy and attention for the task that creates the largest progress and is often postponed. |
Complexitysame | Low | Low | Low | Low |
Timedifferent | 30-60 min | 30-60 min | 45–90 min | 15-90 min daily |
Participantsdifferent | 1-6 | 1-5 | 3-10 | 1 |
Formatdifferent | Workshop + async | Async | Workshop | Async |
Outputdifferent | Pareto Chart, Top Causes, Focus List | ABC Classification, Focus Rules, Control List | Theme clusters, Insight statements, Opportunity areas | Priority Task, Completion Note, Daily Focus |
Tagsno overlap | PrioritizationQualityFocusRoot cause | PrioritizationOperationsPortfolio | SynthesisQualitativeRoot cause | PrioritizationProductivityFocusExecution |