View methods side by side.
Choose up to four methods. Add them using the search and share the comparison by copying its link.
| Criterion |  Product Strategy OKRs | 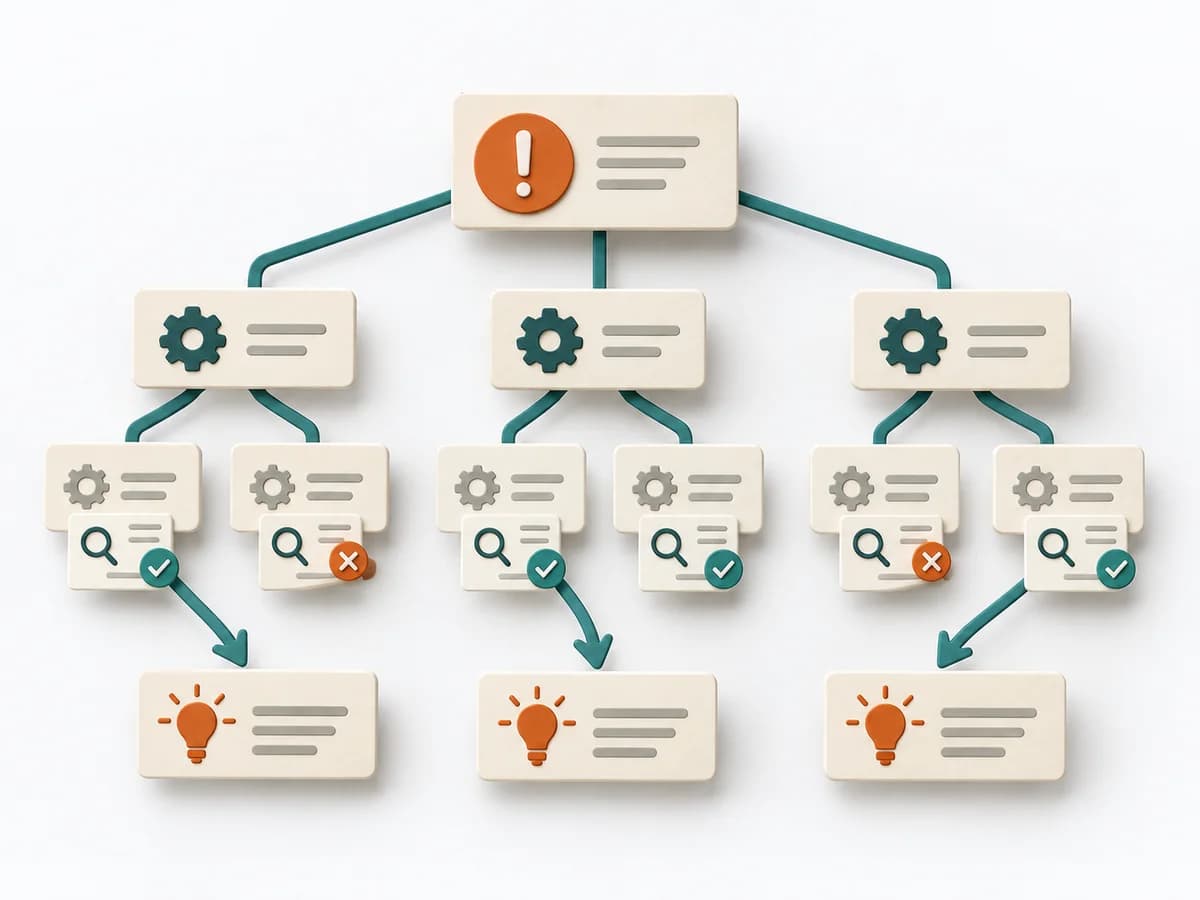 Operations Root Cause Tree Analysis |  Operations 8D Problem Solving |  Product Strategy SMART Goals |
|---|---|---|---|---|
Purposedifferent | When strategic direction needs to become measurable, it connects ambition with checkable results. It makes goals connectable to focus and review. | For a problem with several suspected causes, the method builds a causal structure instead of a mere list. It makes visible how causes connect and where the strongest points of leverage lie. | For an acute quality or delivery problem, the method structures immediate protection and root cause work together. It keeps the situation stable while the actual cause is investigated cleanly. | When goals are formulated too generally, it brings measurability, direction, and timing into shape. It prevents intentions from staying without clear verification. |
Complexitydifferent | Medium | Medium | High | Low |
Timedifferent | 1-2 h Setup | 1-3 h | 1-6 Wochen | 15-30 min |
Participantsdifferent | 2-20 | 2-8 | 4-10 | 1-8 |
Formatdifferent | Workshop + async | Workshop | Workshop + async | Workshop + async |
Outputdifferent | OKR set, Measurement plan, Review cadence | Cause Tree, Evidence Notes, Countermeasures | 8D Report, Containment Plan, Root Cause Evidence, Corrective Action Plan | SMART Goal, Measurement Note, Deadline |
Tagsno overlap | GoalsAlignmentOutcomesMeasurement | Root causeTreeIncidentQuality | QualityProblem solvingRoot cause | GoalsPlanningMeasurementAlignment |