View methods side by side.
Choose up to four methods. Add them using the search and share the comparison by copying its link.
| Criterion | 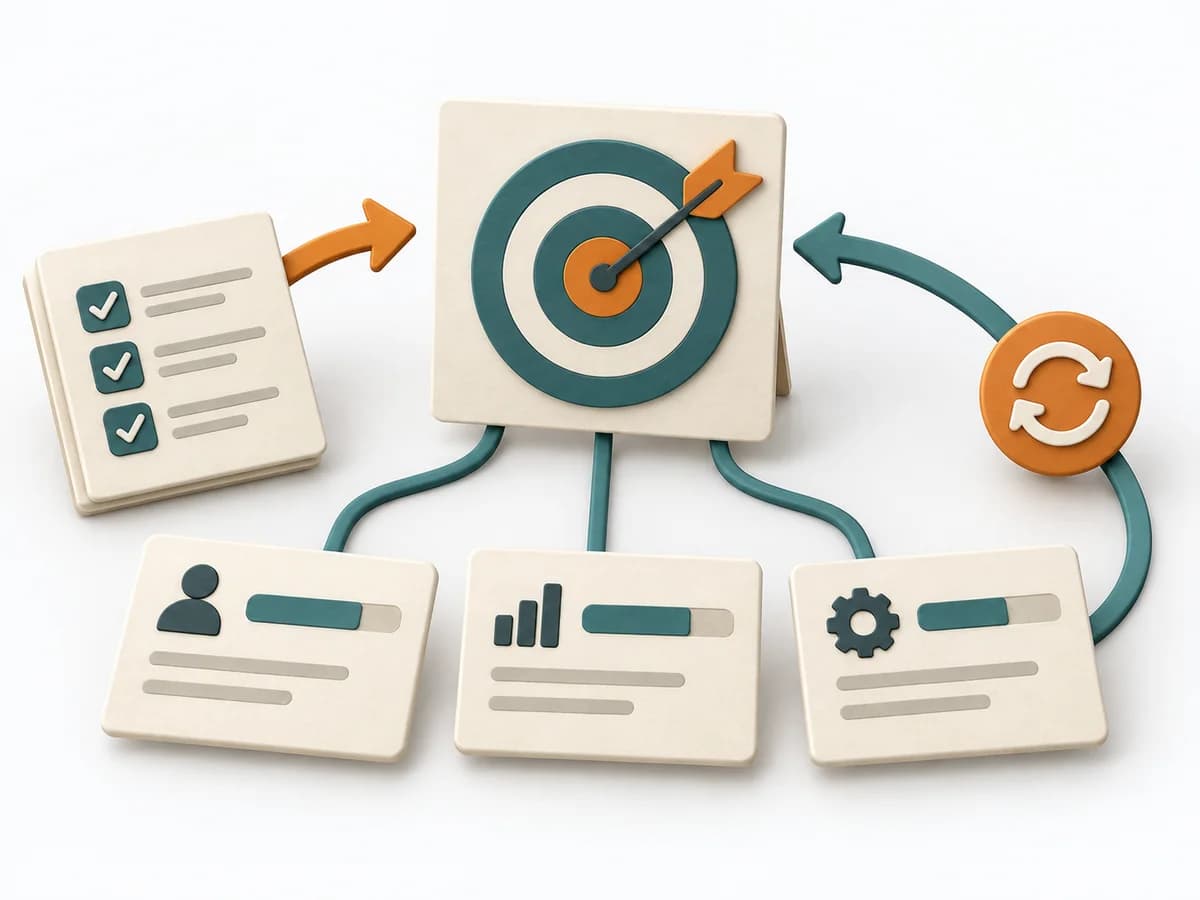 Product Strategy OKRs |  Facilitation Dot Estimation | 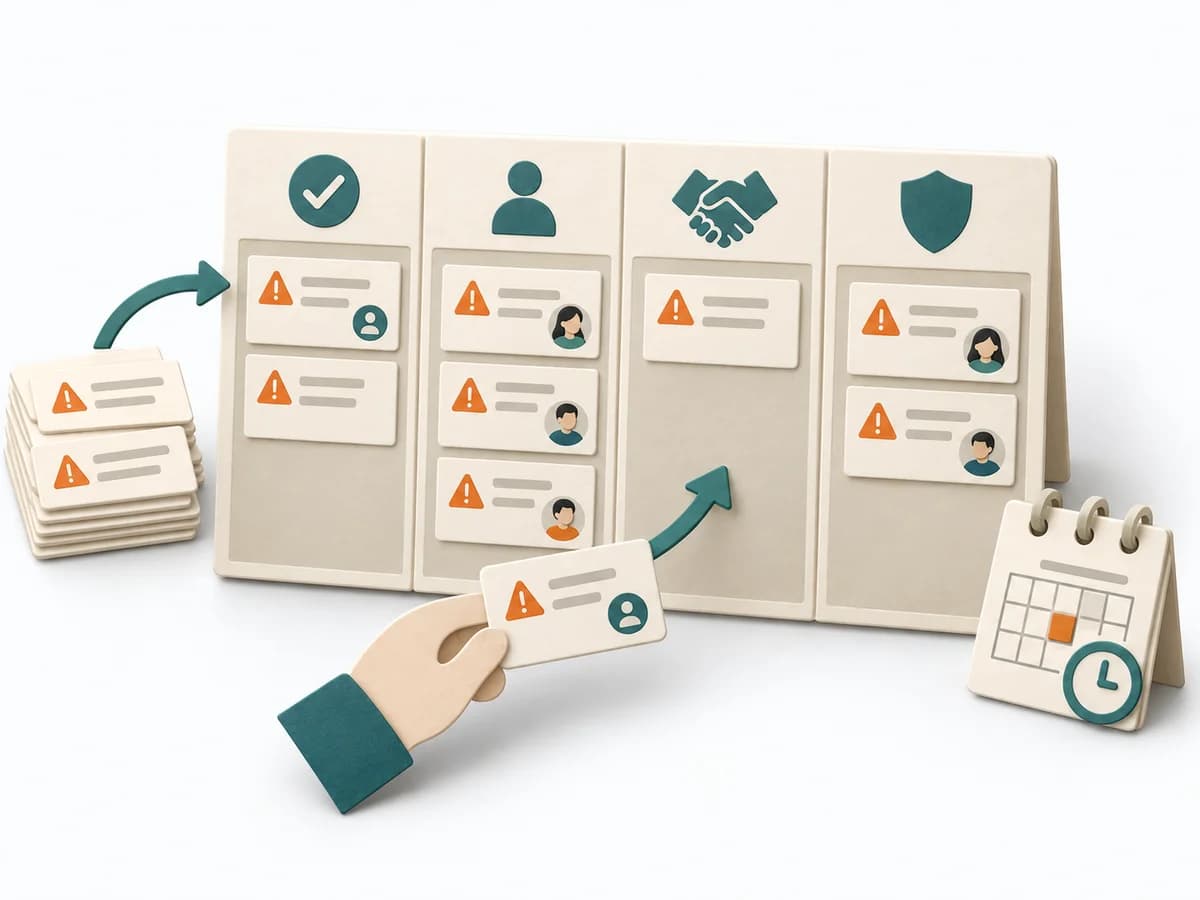 Agile ROAM Board | 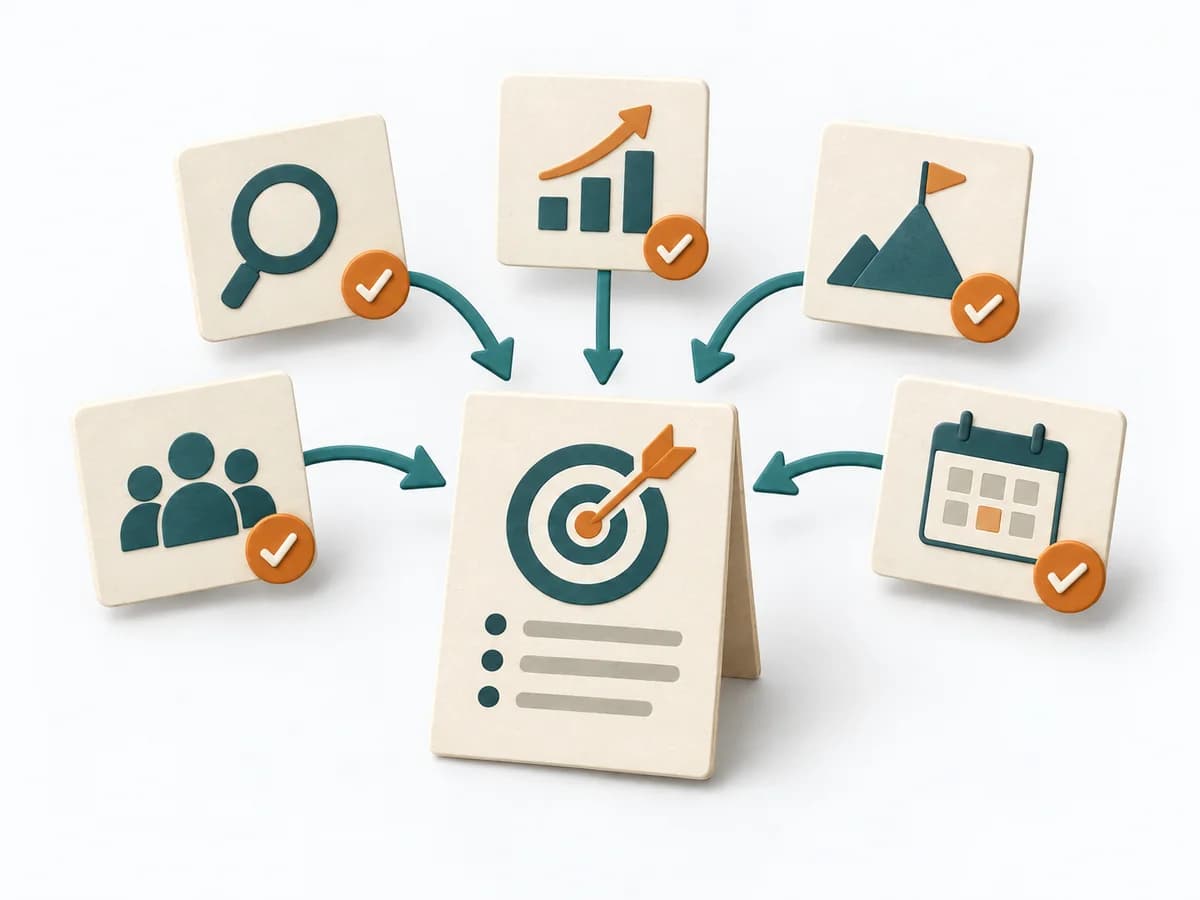 Product Strategy SMART Goals |
|---|---|---|---|---|
Purposedifferent | When strategic direction needs to become measurable, it connects ambition with checkable results. It makes goals connectable to focus and review. | When size or effort can only be estimated roughly, Dot Estimation condenses the group's experience into a quick range. It turns individual contributions into a visible selection. The result is captured as an Effort Heatmap, Risk Signals, and Discussion Targets. | When work needs to move between different states or columns, it makes that movement and its handoffs legible. It sorts work by value, risk, and delivery ability. The result is captured as a ROAM Board and an Owner List. | When goals are formulated too generally, it brings measurability, direction, and timing into shape. It prevents intentions from staying without clear verification. |
Complexitydifferent | Medium | Low | Low | Low |
Timedifferent | 1-2 h Setup | 5-20 min | 20-40 min initial, dann laufend | 15-30 min |
Participantsdifferent | 2-20 | 3-20 | 3-15 | 1-8 |
Formatdifferent | Workshop + async | Workshop | Workshop + async | Workshop + async |
Outputdifferent | OKR set, Measurement plan, Review cadence | Effort Heatmap, Risk Signals, Discussion Targets | ROAM Board, Owner List | SMART Goal, Measurement Note, Deadline |
Tagsno overlap | GoalsAlignmentOutcomesMeasurement | EstimationEffortRisk | RiskAgileTrackingAlignment | GoalsPlanningMeasurementAlignment |