View methods side by side.
Choose up to four methods. Add them using the search and share the comparison by copying its link.
| Criterion | 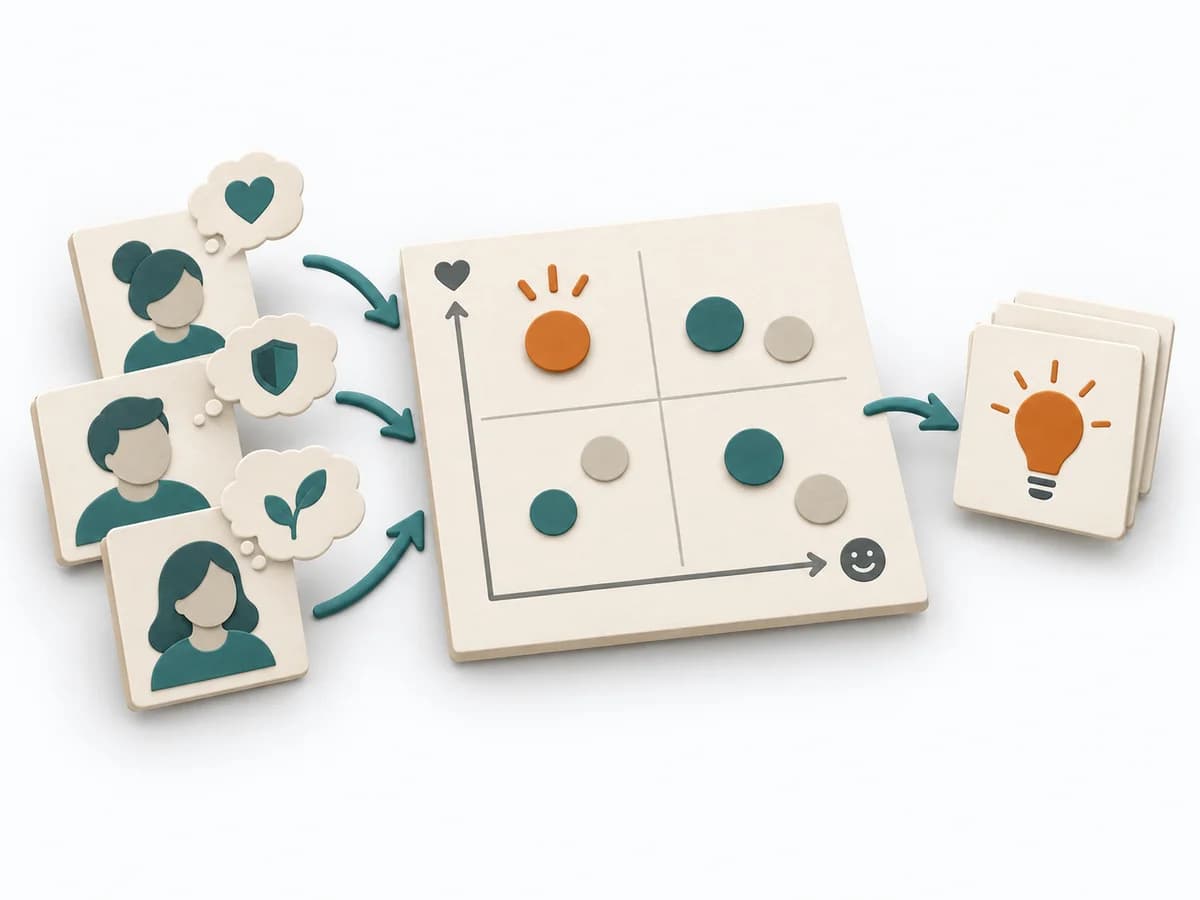 Product Discovery Outcome-Driven Innovation |  UX Research Empathy Mapping | 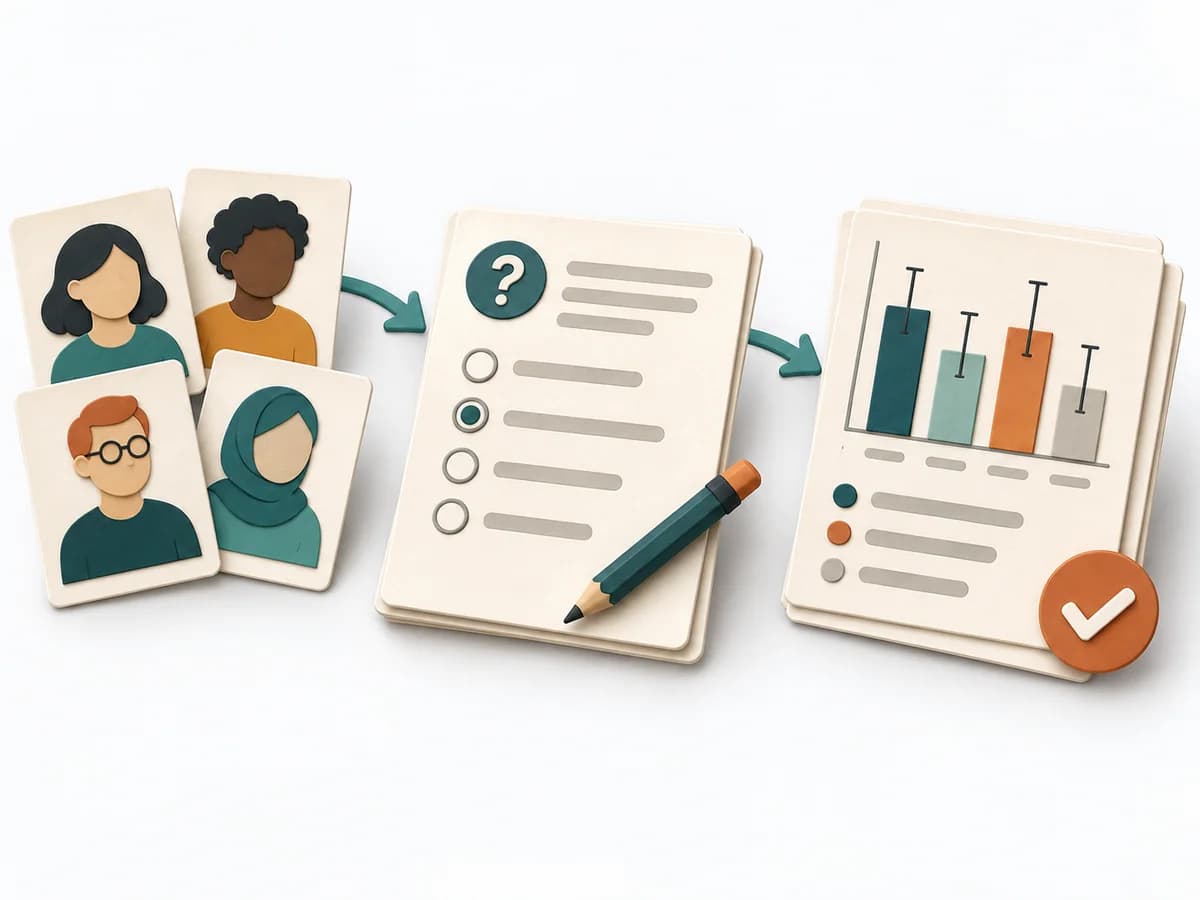 UX Research Surveys |  UX Research Affinity Diagramming |
|---|---|---|---|---|
Purposedifferent | Outcome-Driven Innovation clarifies customer problems, solution opportunities, and evidence. It separates jobs, desired outcomes, importance, satisfaction, and opportunity, and captures results as desired outcome statements, an opportunity landscape, and segments by underserved needs. | When a lot is assumed about a target group but little is seen jointly, empathy mapping makes knowledge and gaps directly comparable. The picture also shows which assumptions hold up and where evidence is missing. | When a topic needs to be validated broadly and many people can answer the same question, surveys gather structured feedback in a scalable form. Answers become comparable and segmentable instead of remaining merely anecdotal. | When research notes, feedback, or observations sit unconnected side by side, affinity diagramming sorts the raw material into solid themes. Many individual points turn into patterns that make decisions and opportunities clearer. |
Complexitydifferent | High | Low | Medium | Low |
Timedifferent | Mehrere Wochen | 30–60 min | 3-14 Tage | 45–90 min |
Participantsdifferent | 2-6 researchers plus sample | 4-8 | 50+ | 3-10 |
Formatdifferent | Workshop + async | Workshop | Async | Workshop |
Outputdifferent | Desired outcome statements, Opportunity landscape, Segmentation by underserved needs, Innovation hypotheses | Empathy Map, Assumptions List, Research Gaps | Survey Results, Charts, Segment Insights | Theme clusters, Insight statements, Opportunity areas |
Tagsno overlap | OutcomesInnovationResearchQuantitative | SynthesisQualitativeWorkshop | QuantitativeResearchValidation | SynthesisQualitativeRoot cause |