View methods side by side.
Choose up to four methods. Add them using the search and share the comparison by copying its link.
| Criterion | 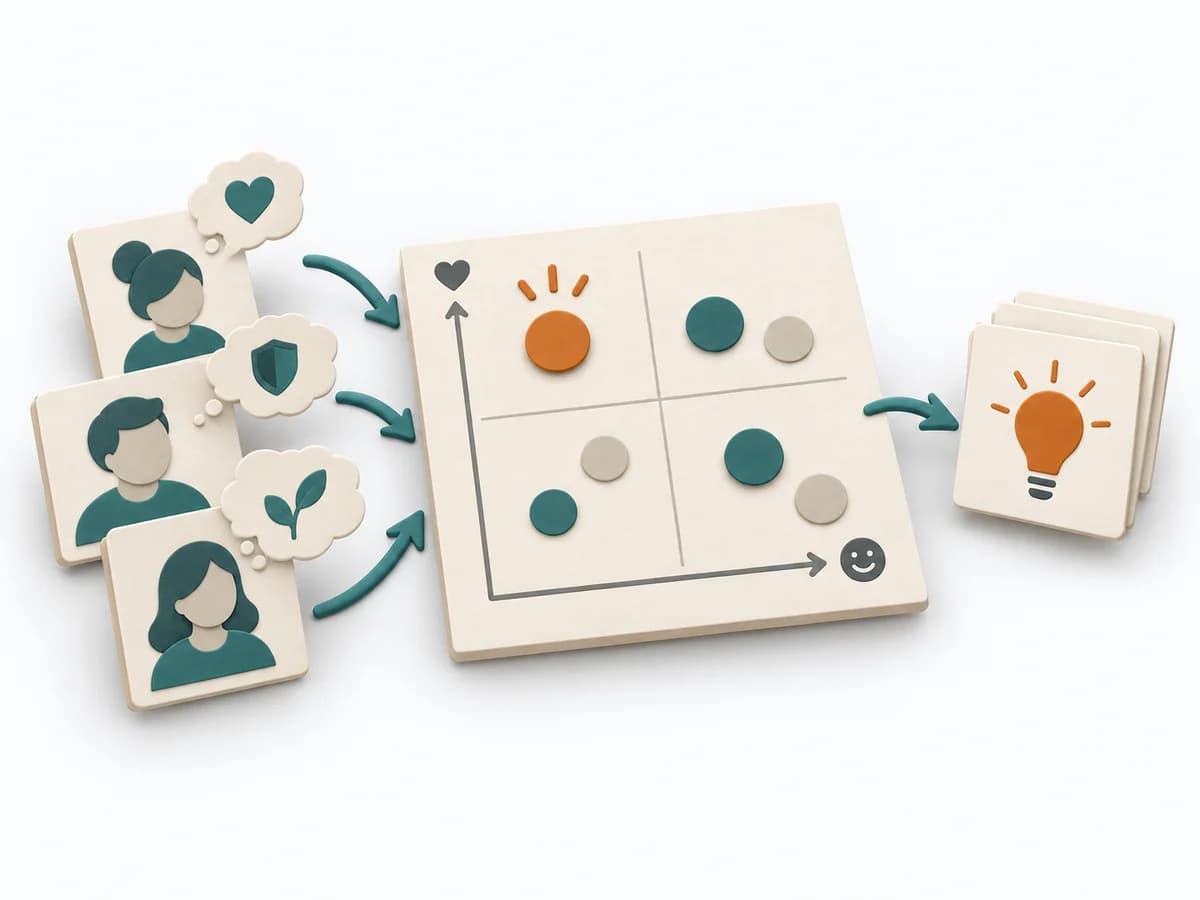 Product Discovery Outcome-Driven Innovation |  Systems Thinking Causal Loop Diagram | 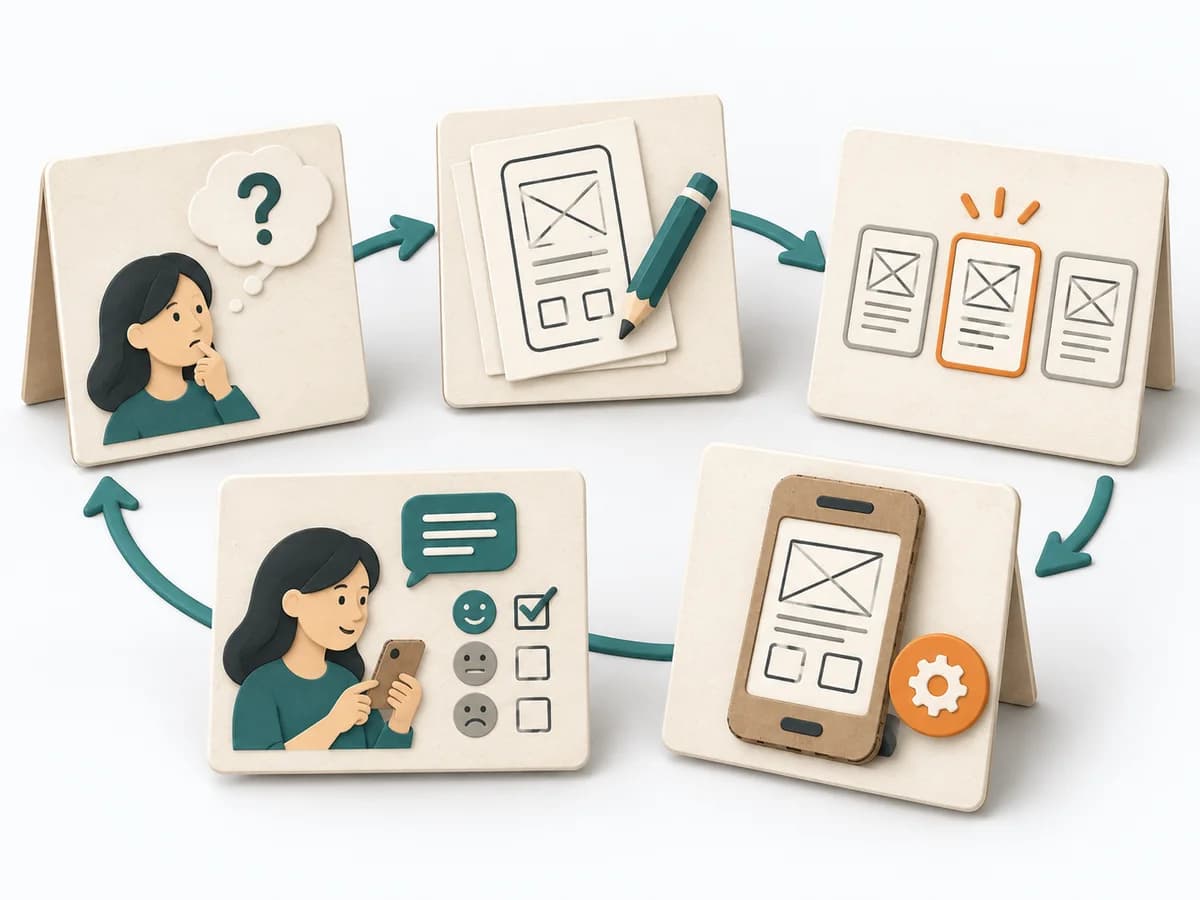 Innovation Design Sprint | 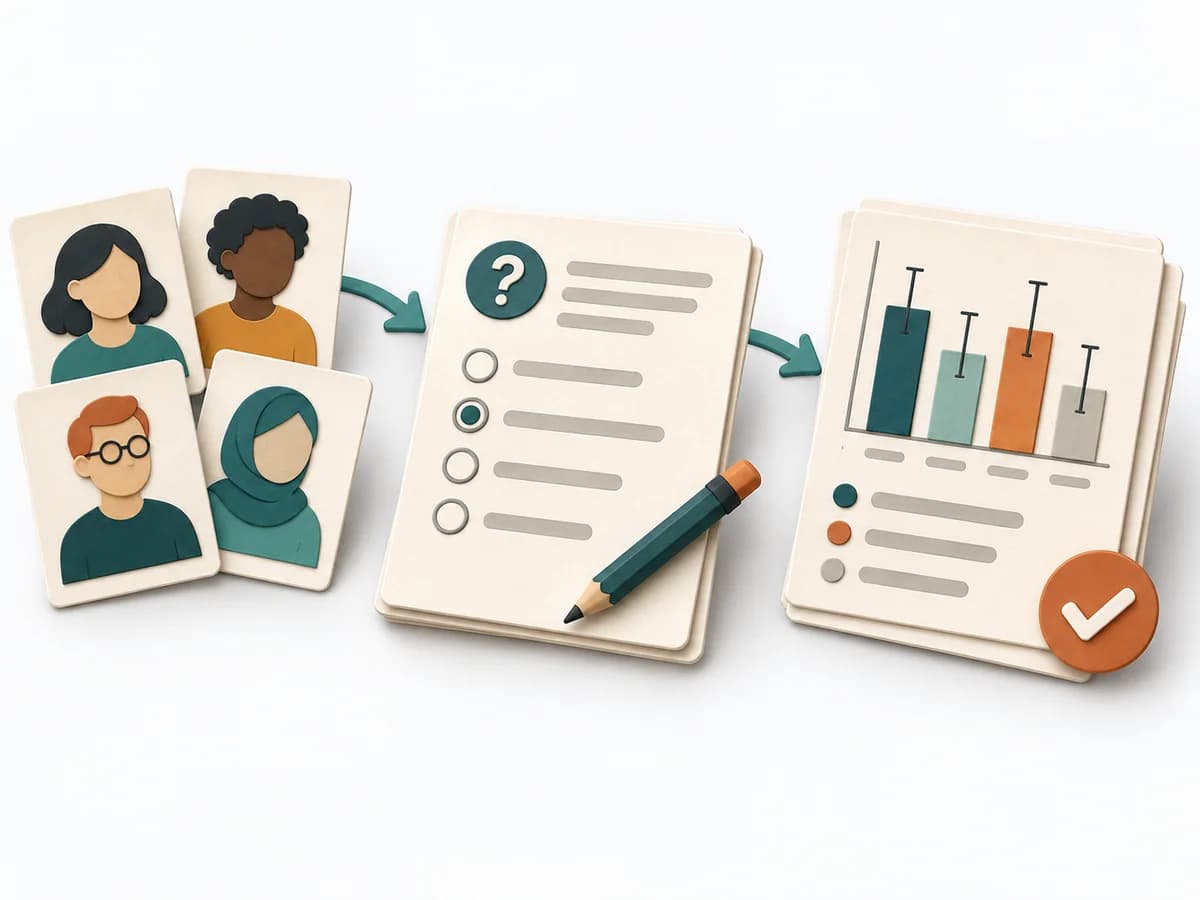 UX Research Surveys |
|---|---|---|---|---|
Purposedifferent | Outcome-Driven Innovation clarifies customer problems, solution opportunities, and evidence. It separates jobs, desired outcomes, importance, satisfaction, and opportunity, and captures results as desired outcome statements, an opportunity landscape, and segments by underserved needs. | A Causal Loop Diagram makes feedback, reinforcement, and balance in a system legible. It uncovers side effects and self-reinforcement that stay hidden in linear explanations. | When the product question is unclear and time pressure is high, the method takes a team from an open idea to a testable solution. It connects problem understanding, decision, and learning in one compact format, lowering the risk of spending a lot of energy on a mere guess. | When a topic needs to be validated broadly and many people can answer the same question, surveys gather structured feedback in a scalable form. Answers become comparable and segmentable instead of remaining merely anecdotal. |
Complexitydifferent | High | Medium | High | Medium |
Timedifferent | Mehrere Wochen | 1-3 h | 4-5 Tage | 3-14 Tage |
Participantsdifferent | 2-6 researchers plus sample | 2-8 | 5-8 | 50+ |
Formatdifferent | Workshop + async | Workshop | Workshop | Async |
Outputdifferent | Desired outcome statements, Opportunity landscape, Segmentation by underserved needs, Innovation hypotheses | Causal Loop Diagram, Feedback Notes, Leverage Points | Prototype, Test Findings, Decision Rationale | Survey Results, Charts, Segment Insights |
Tagsno overlap | OutcomesInnovationResearchQuantitative | FeedbackSystems thinkingCausalityDynamics | Design sprintPrototypeValidationInnovation | QuantitativeResearchValidation |