View methods side by side.
Choose up to four methods. Add them using the search and share the comparison by copying its link.
| Criterion |  Growth North Star Metric |  Facilitation Stakeholder Mapping |  Facilitation Storytelling | 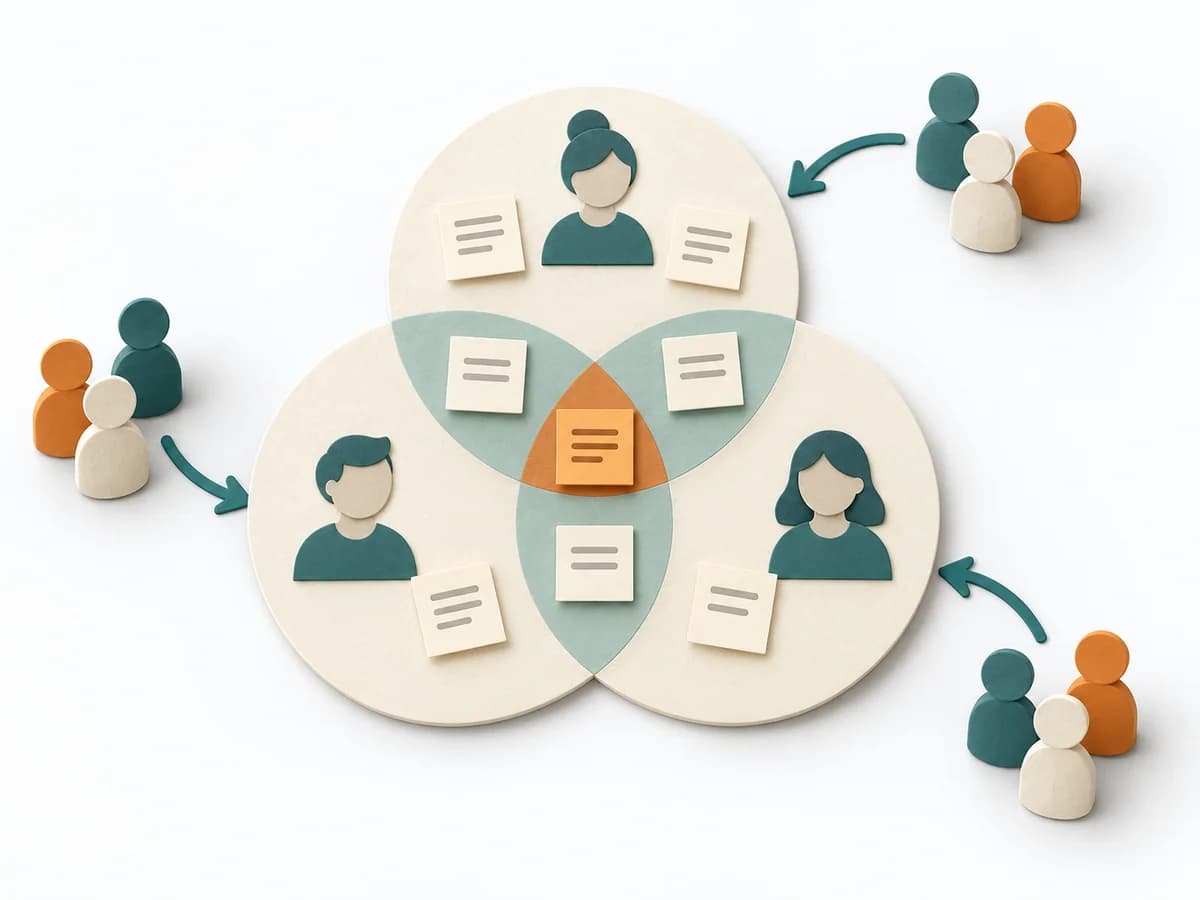 Facilitation 3-Circle Venn Diagram |
|---|---|---|---|---|
Purposedifferent | When product teams track many metrics, the view of the actual customer outcome easily gets lost. A North Star Metric bundles growth, usage, and value contribution into one signal that makes the system's direction visible. | When an initiative depends on many people, interests, and power dynamics, Stakeholder Mapping systematically orders the environment. It shows who influences, who is affected, and where relationship management or safeguarding matters first. | When an insight needs to have an effect, storytelling translates dry facts into a comprehensible development. It combines context, tension, and consequence into a form that people remember and pass on more easily. | When three perspectives matter at the same time, a Three-Circle Venn Diagram shows the overlaps and remainders precisely. It makes visible where shared effect arises and where only a partial perspective applies. |
Complexitydifferent | Medium | Low | Medium | Low |
Timedifferent | 1-2 h | 60–90 min | 45-120 min | 15-45 min |
Participantsdifferent | 3-8 | 2-8 | 1-6 | 2-8 |
Formatsame | Workshop + async | Workshop + async | Workshop + async | Workshop + async |
Outputdifferent | North Star metric, Input metric tree, Measurement cadence | Stakeholder Map, Engagement Plan, Risk Notes | Narrative Outline, Key Message, Story Arc | Venn Diagram, Overlap Notes, Differentiators |
Tagsno overlap | GrowthMetricsAlignmentRetention | StakeholdersAlignmentFacilitationChange | CommunicationNarrativeStakeholdersFacilitation | ComparisonFacilitationAlignment |