View methods side by side.
Choose up to four methods. Add them using the search and share the comparison by copying its link.
| Criterion |  Growth North Star Metric | 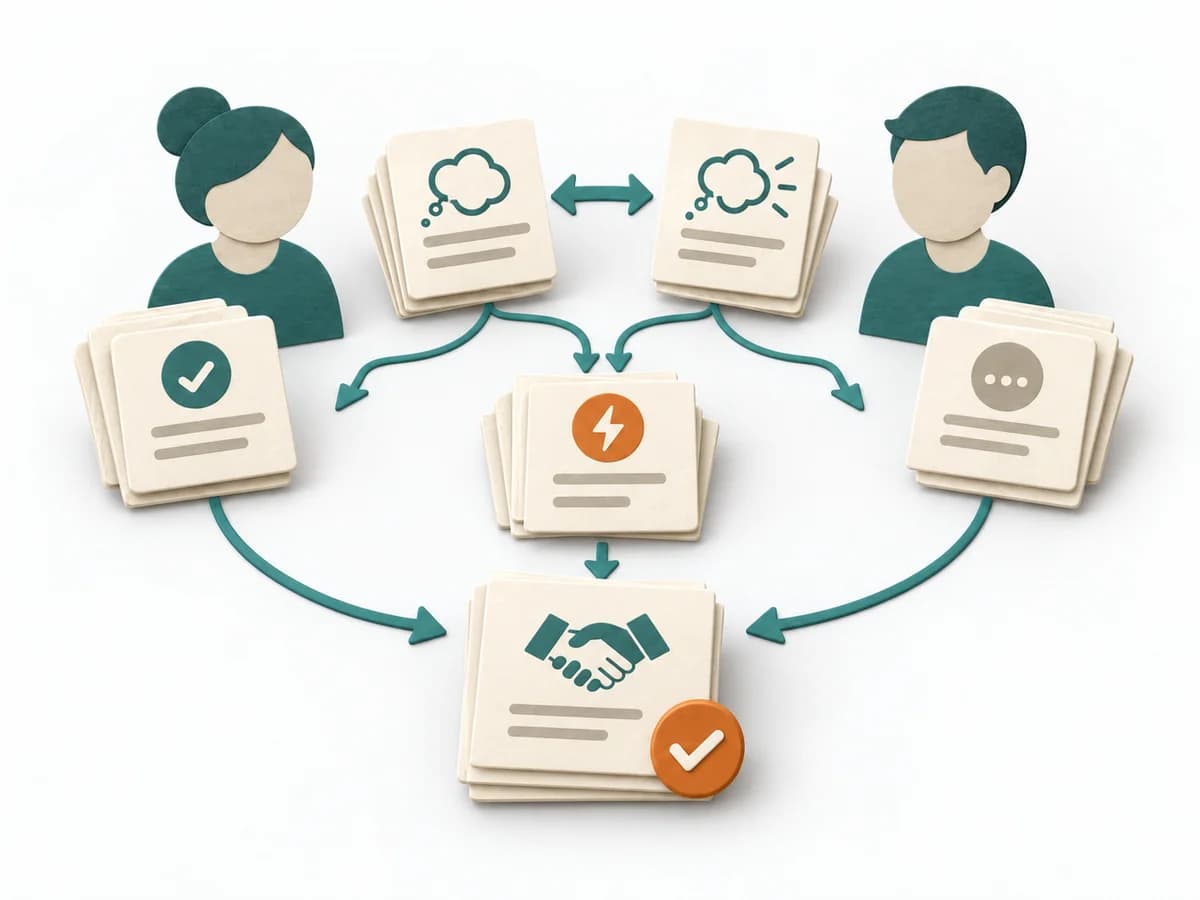 Facilitation Expectation Mapping |  Business Strategy Ansoff Matrix |  Facilitation Alignment Mapping |
|---|---|---|---|---|
Purposedifferent | When product teams track many metrics, the view of the actual customer outcome easily gets lost. A North Star Metric bundles growth, usage, and value contribution into one signal that makes the system's direction visible. | When roles, interfaces, or projects fail because of differing expectations, Expectation Mapping surfaces these differences. It shows what each side takes for granted and where the pictures diverge. | The Ansoff Matrix organizes growth options by market and product relation. It helps weigh expansion, diversification, and adaptation cleanly against each other. | When several people work toward one goal but hold different mental maps, Alignment Mapping makes the discrepancies visible. It arranges goals, assumptions, and priorities so shared direction becomes verifiable. |
Complexitydifferent | Medium | Low | Low | Medium |
Timedifferent | 1-2 h | 45-90 min | 45-90 min | 1-2 h |
Participantsdifferent | 3-8 | 3-12 | 2-8 | 4-12 |
Formatdifferent | Workshop + async | Workshop | Workshop + async | Workshop |
Outputdifferent | North Star metric, Input metric tree, Measurement cadence | Expectation Map, Alignment Notes, Agreements | Ansoff Matrix, Growth Options, Risk Notes | Alignment Map, Open Issues, Decision Questions |
Tagsno overlap | GrowthMetricsAlignmentRetention | AlignmentStakeholdersTeam | GrowthStrategyMarketPortfolio | AlignmentStakeholdersStrategyFacilitation |