View methods side by side.
Choose up to four methods. Add them using the search and share the comparison by copying its link.
| Criterion |  Growth North Star Metric | 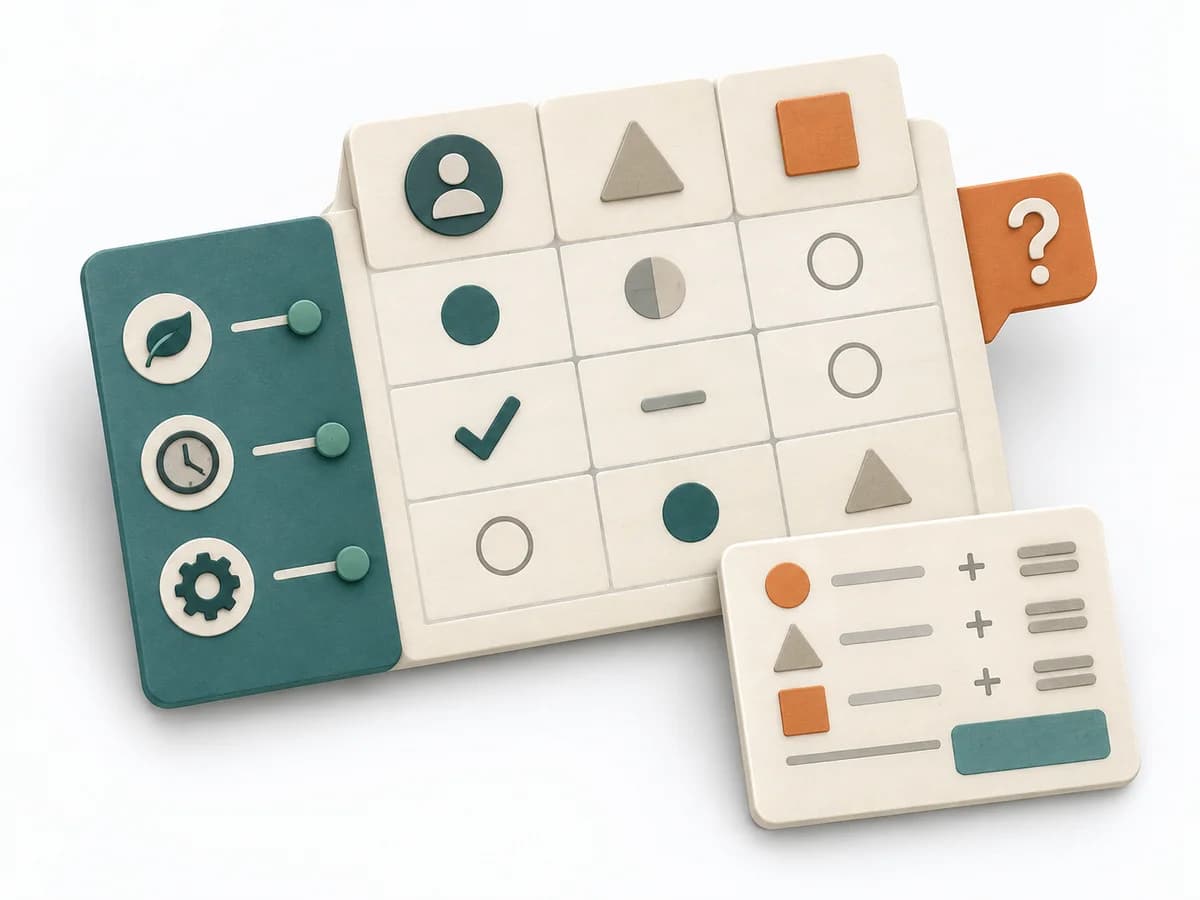 Decision Making Decision Matrix | 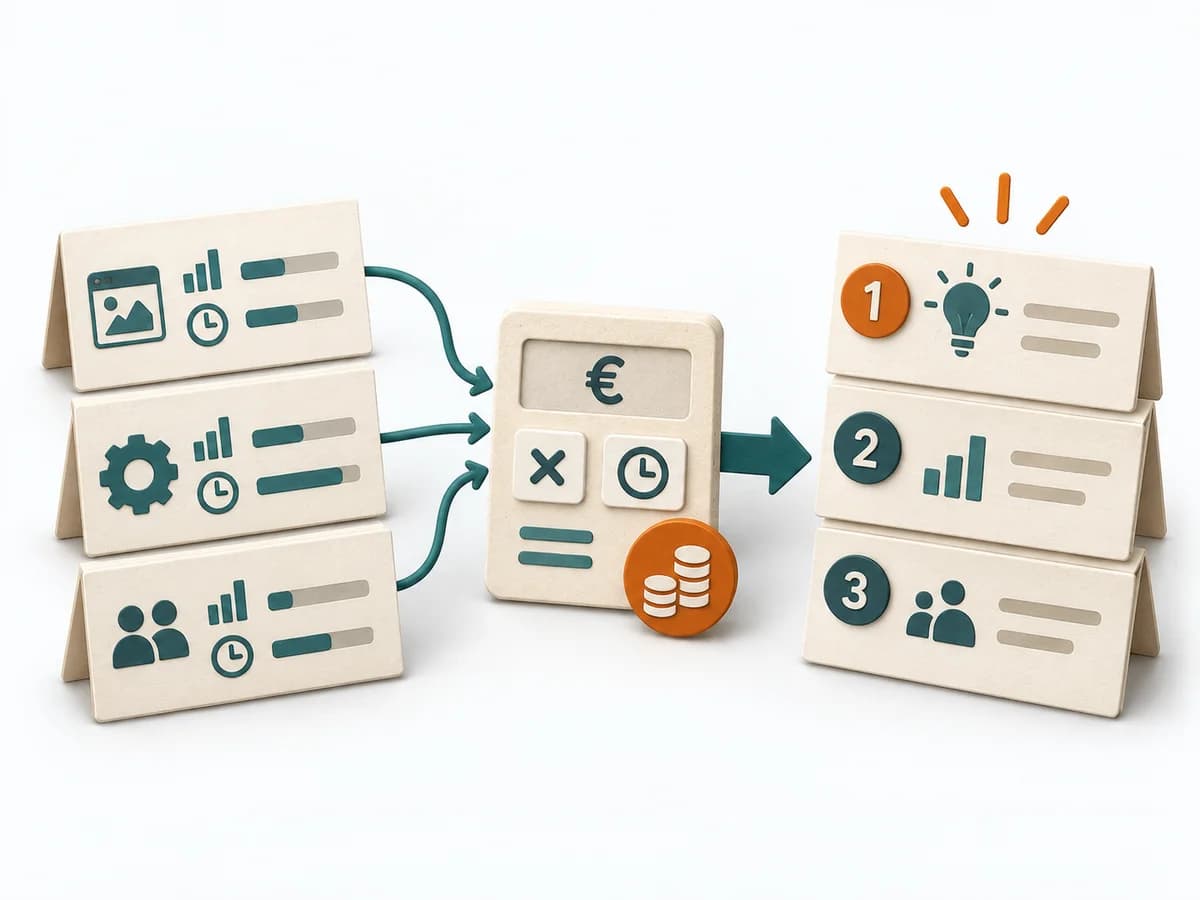 Delivery Cost of Delay |  Decision Making DACI |
|---|---|---|---|---|
Purposedifferent | When product teams track many metrics, the view of the actual customer outcome easily gets lost. A North Star Metric bundles growth, usage, and value contribution into one signal that makes the system's direction visible. | When several options collide with several criteria, comparison quickly becomes subjective. A Decision Matrix makes the trade-off visible and brings weighting, criteria, and options into a shared logic. | Helps clarify scope, order, and delivery flow in concrete terms. It makes work, constraints, and sequence manageable. The result is captured as a Cost of Delay table and prioritization sequence. | In cross-functional decisions, responsibilities quickly blur between approval, influence, and execution. DACI arranges these roles so decision pressure, contribution, and information stay cleanly separated. |
Complexitydifferent | Medium | Medium | High | Low |
Timedifferent | 1-2 h | 45-90 min | 90-180 min | 30-60 min |
Participantsdifferent | 3-8 | 2-8 | 3-8 | 2-10 |
Formatdifferent | Workshop + async | Workshop + async | Workshop | Workshop + async |
Outputdifferent | North Star metric, Input metric tree, Measurement cadence | Decision Matrix, Scoring Rationale, Selected Option | CoD Table, Prioritization Sequence | DACI Matrix, Decision Owner, Decision Log |
Tagsno overlap | GrowthMetricsAlignmentRetention | DecisionCriteriaScoringTradeoffs | PrioritizationDeliveryEconomicsDecision | DecisionRolesGovernanceAlignment |