View methods side by side.
Choose up to four methods. Add them using the search and share the comparison by copying its link.
| Criterion |  Agile NoEstimates | 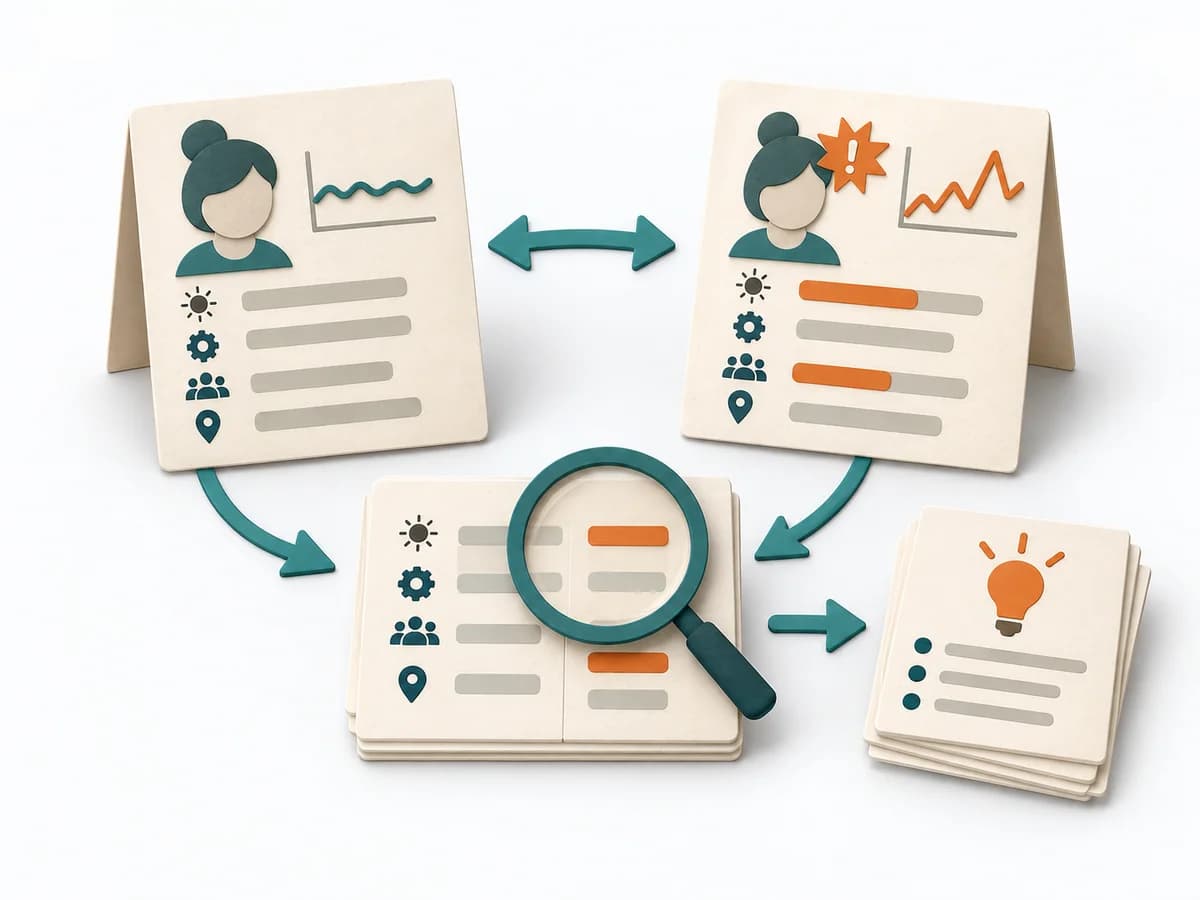 Operations Change Analysis |  Operations 8D Problem Solving |  Operations Fishbone Diagram |
|---|---|---|---|---|
Purposedifferent | When estimating slows a team down more than it helps, it shifts the focus to flow, small slices, and real lead time. It sorts work by value, risk, and delivery ability. The result is captured as Throughput Data, Flow Forecast, and Slicing Rules. | For a deviation after a change, the method isolates the influence of the altered condition. It narrows down which differences are relevant and which are just accompanying noise. | For an acute quality or delivery problem, the method structures immediate protection and root cause work together. It keeps the situation stable while the actual cause is investigated cleanly. | When a problem has several possible contributing factors, the method sorts causes by cause areas. It prevents an initial hunch from blocking the view of other plausible drivers. |
Complexitydifferent | Medium | Medium | High | Low |
Timedifferent | laufend | 45-120 min | 1-6 Wochen | 30-60 min |
Participantsdifferent | 2-12 | 2-6 | 4-10 | 2-8 |
Formatdifferent | Workshop + async | Workshop + async | Workshop + async | Workshop |
Outputdifferent | Throughput Data, Flow Forecast, Slicing Rules | Change Matrix, Cause Hypotheses, Validation Questions, Action List | 8D Report, Containment Plan, Root Cause Evidence, Corrective Action Plan | Fishbone Diagram, Cause Categories, Investigation Backlog |
Tagsno overlap | EstimationForecastingFlow | ChangeRoot causeTroubleshootingComparison | QualityProblem solvingRoot cause | Root causeQualityOperations |