View methods side by side.
Choose up to four methods. Add them using the search and share the comparison by copying its link.
| Criterion |  Delivery Monte Carlo Forecasting | 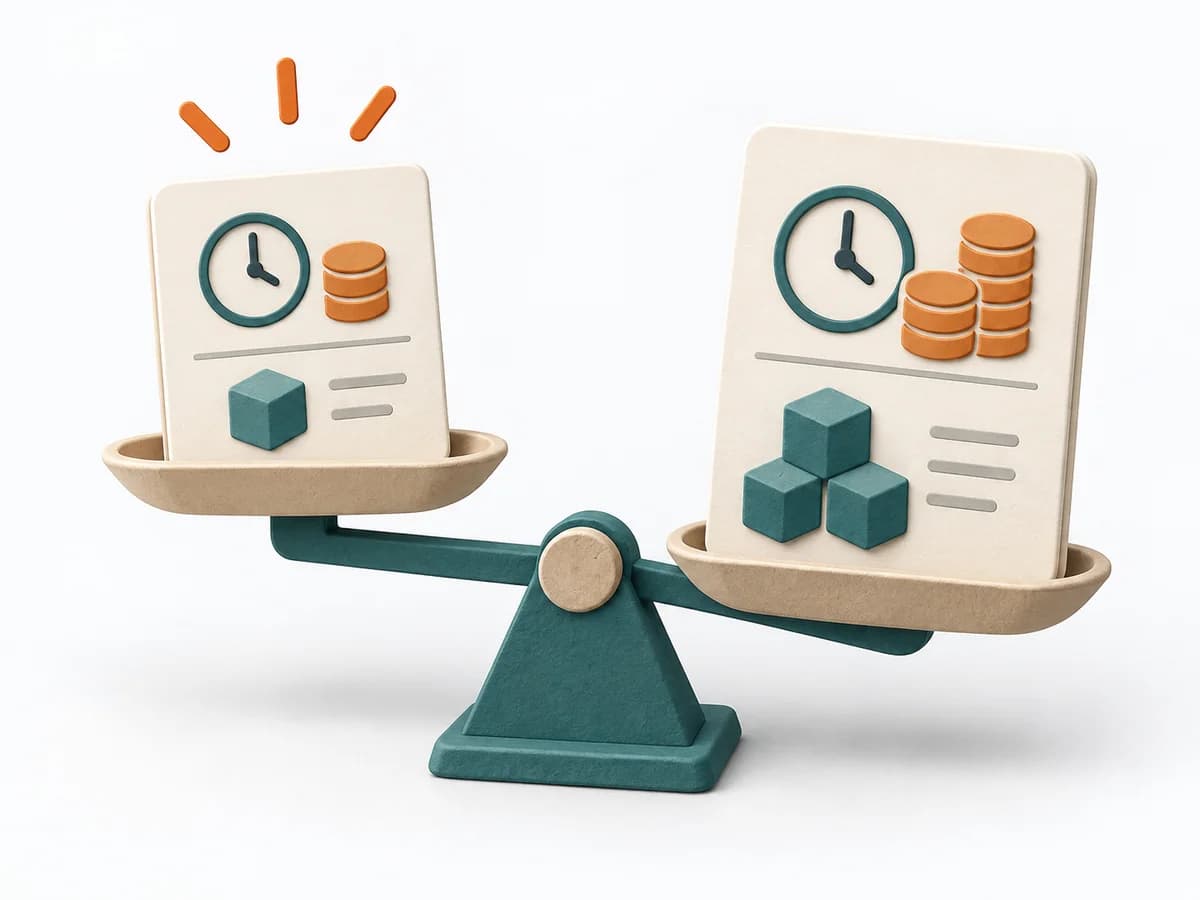 Agile WSJF | 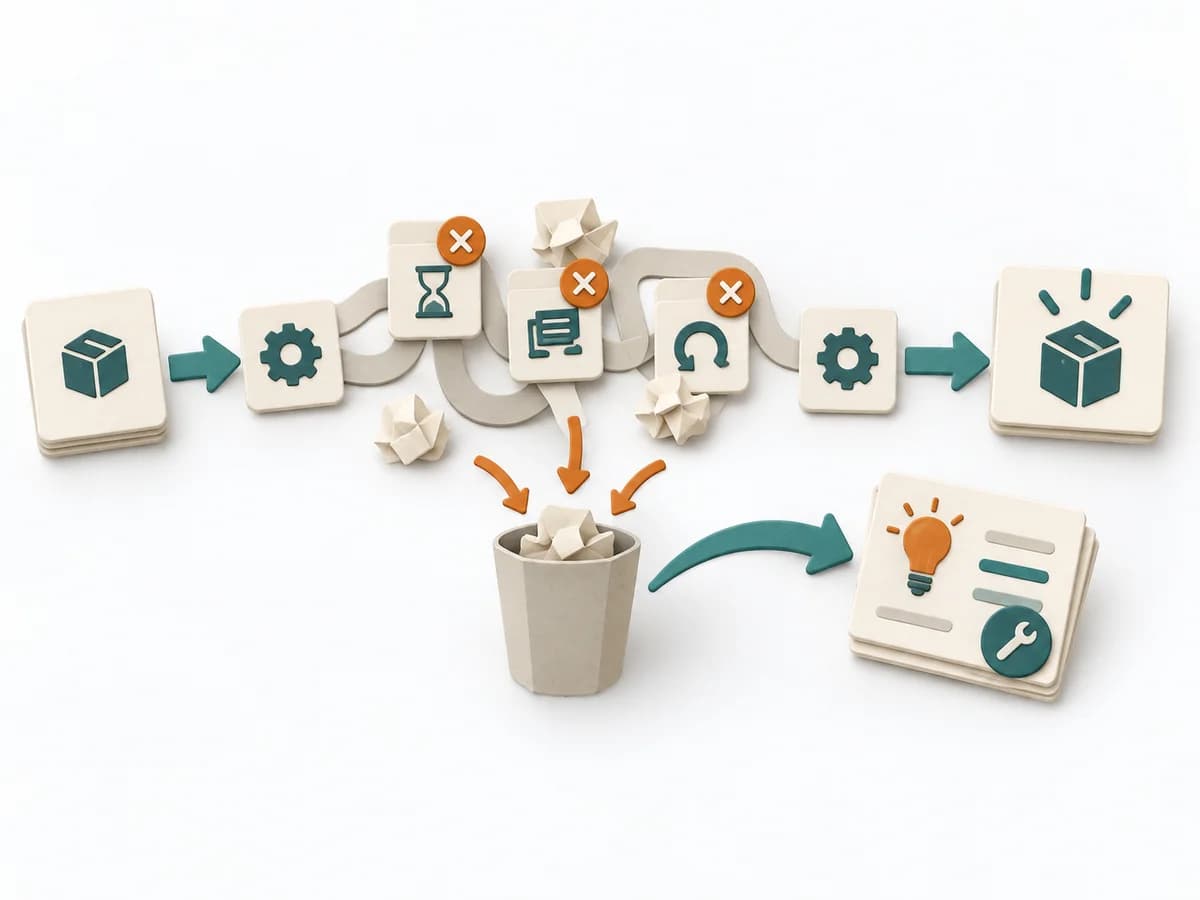 Operations Waste Analysis |  Delivery Value Stream Mapping |
|---|---|---|---|---|
Purposedifferent | Helps clarify scope, sequence, and delivery flow in concrete terms. It makes work, boundaries, and order steerable. The result is captured as Forecast Percentiles, Throughput Dataset, and Risk Communication. | When many tasks compete for the same capacity, it orders work by economic impact. It makes time lost, benefit, and effort comparable together. | For a process that keeps people busy but creates little value, the method exposes waste. It directs attention to unnecessary movement, waiting times, rework, and overdelivery. | When delivery work dissolves into wait times, handoffs, and hidden effort, Value Stream Mapping makes the actual flow visible. The method exposes bottlenecks, idle time, and feedback loops so lead time and improvement levers become tangible. |
Complexitydifferent | High | High | Low | Medium |
Timedifferent | 30-90 min Setup, danach laufend | 45-90 min | 45-120 min | 1-3 h |
Participantsdifferent | 1-8 | 3-10 | 2-8 | 4-10 |
Formatdifferent | Workshop + async | Workshop | Workshop | Workshop |
Outputdifferent | Forecast Percentiles, Throughput Dataset, Risk Communication | Ranked Backlog, Cost-of-Delay Assumptions | Waste Map, Prioritized Waste, Improvement Backlog | Current-state map, Future-state map, Bottleneck list |
Tagsno overlap | ForecastingFlowDelivery | LeanEconomicsSequencePrioritization | WasteLeanProcess improvement | LeanFlowWasteDelivery |